Developer Tools●●Solid
Let AI agents debug your Valkey/Redis
MCP server for Valkey monitoring when generic database MCP tools already exist.
Niche Gem
kaliades
204mo ago

Persists Redis/Valkey's ephemeral observability data with rigorous interleaved benchmarking proving sub-1% overhead.
DevOps engineers, SREs, and platform teams running Valkey or Redis in production.
Redis Cloud observability dashboards · Datadog/New Relic Redis monitoring modules · RedisInsight (official Redis GUI)
The core problem: Valkey and Redis expose useful operational data (slowlog, latency stats, client lists, memory breakdowns), but it's all ephemeral. Restart your server and it's gone. Existing tools show real-time charts but can't tell you what happened at 3am when your p99 spiked.
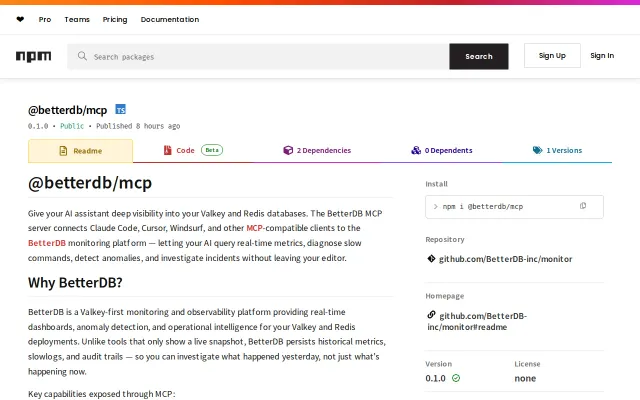
BetterDB persists this ephemeral data and turns it into actionable insights:
- Historical analytics for queries (slowlog and commandlog patterns aggregated by type), clients (commands, connections, buffers), and ACL activity - Anomaly detection and 99 Prometheus metrics - Cluster visualization with topology graphs and slot heatmaps - Automated latency and memory diagnostics - AI assistant for querying your instance in plain English (via local Ollama) - Sub-1% performance overhead
On that last point — I wrote up our interleaved A/B benchmarking methodology in detail: https://www.betterdb.com/blog/interleaved-testing. Most tools claim "minimal overhead" without showing their work. We open-sourced the benchmark suite so you can run it on your own hardware and verify.
You can try it right now:
npx @betterdb/monitor
Or via Docker:docker run -d -p 3001:3001 betterdb/monitor
BetterDB follows an open-core model under the OCV Open Charter (which prevents future licensing changes). The community edition is free with real monitoring value. Pro and Enterprise tiers add historical persistence, alerting, and compliance features, but are free for now and will be at least until end of month.We're building this in public — the benchmark suite, the technical blog posts, and the roadmap are all out in the open. Would love feedback from production users of Valkey or Redis on what observability gaps you're still hitting.
GitHub: https://github.com/BetterDB-inc/monitor Blog: https://www.betterdb.com/blog
MCP server for Valkey monitoring when generic database MCP tools already exist.
Slowlog persistence solves real Redis pain—captures every entry before rotation, no VPC peering required.
Beats Valkey on GET and SET benchmarks while guaranteeing memory safety with Rust.
Redis hosting, but Upstash and Redis Cloud already own this space.
Valkey vector search for Claude Code memory—clever glue, narrow audience.
pgweb for Redis—all data types, auto-decompression, but addresses a solved problem.