Finance●Mid
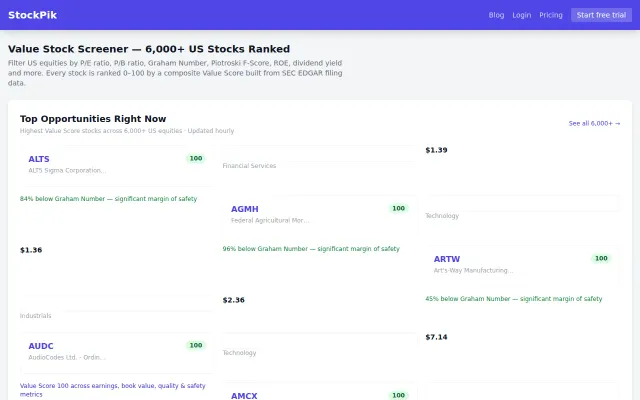
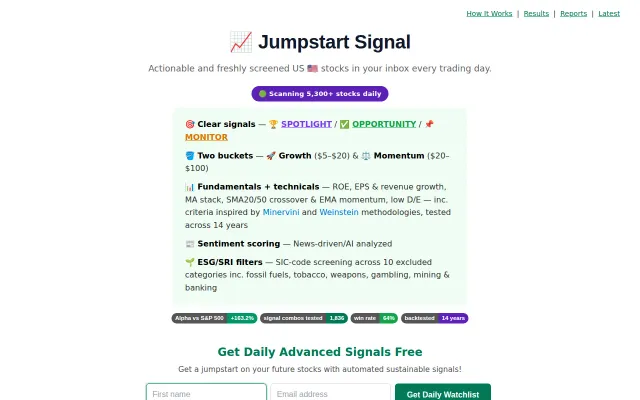
Value stock screener built around Graham Number and Piotroski F-Score
Yet another stock screener when Finviz and Yahoo Finance already do this.
Slick
ecosystemj
102mo ago

Regression channel Z-scores across timeframes, but TradingView and QuantConnect dominate quant screening.
Quantitative traders and retail investors seeking statistical overbought/oversold signals across watchlists.
TradingView screener · QuantConnect · Finviz Elite
I built ZcoreAI, a quant stock scanner that applies Donchian-Weighted regression channels to compute Z-scores across multiple timeframes simultaneously.
The idea: instead of eyeballing charts, you get a matrix of Z-score values per ticker per timeframe in one scan — so you can spot statistically overbought/oversold signals across your watchlist in seconds.
How it works: - Pick timeframes (1m to 1wk) - Pick tickers (or use the preloaded free watchlist) - Hit scan — regression channels + Z-scores are computed client-side via yfinance
Stack: Python, Streamlit, yfinance, NumPy. Deployed on Render.
Free tier available, no signup required to scan.
Happy to discuss the regression channel methodology or any feedback on the approach.
Hey HN,
I built ZcoreAI, a quant stock scanner that applies Donchian-Weighted regression channels to compute Z-scores across multiple timeframes simultaneously.
The idea: instead of eyeballing charts, you get a matrix of Z-score values per ticker per timeframe in one scan — so you can spot statistically overbought/oversold signals across your watchlist in seconds.
How it works: - Pick timeframes (1m to 1wk) - Pick tickers (or use the preloaded free watchlist) - Hit scan — regression channels + Z-scores are computed client-side via yfinance
Stack: Python, Streamlit, yfinance, NumPy. Deployed on Render.
Free tier available, no signup required to scan.
Happy to discuss the regression channel methodology or any feedback on the approach.
Yet another stock screener when Finviz and Yahoo Finance already do this.
Computes a regression‑channel Z‑score across timeframes and presents a compact signal matrix (with an ‘expert’ view that exposes raw Z values) — a useful narrow tool if your workflow is 'find oversold across many symbols fast'. It’s a focused MVP that nails the scanning idea, but crucial details are missing: data source and backtest/validation, alert/export hooks, and a more usable workflow to act on the signals.
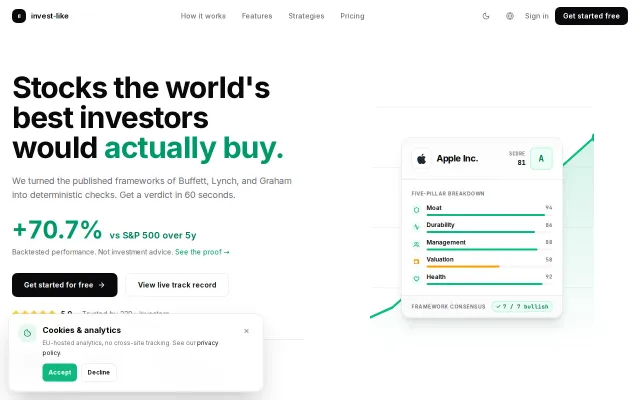
Buffett-style stock scoring when Morningstar and Simply Wall St already do this.
Publishes losing trades openly, unlike most hype-driven stock pickers.
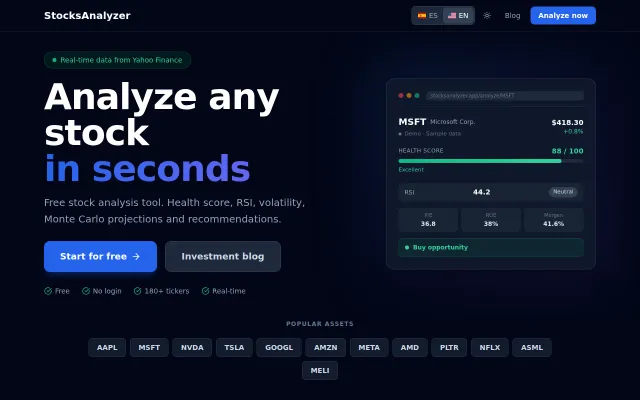
Pretty stock dashboard, but Finviz, TradingView, and Yahoo Finance already do this better.
Free, no-signup skin type analysis, but Baumann classification and vision AI exist separately elsewhere.