Developer Tools●Mid
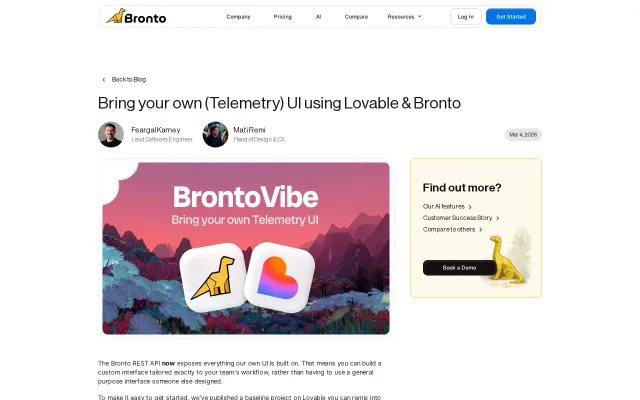
Bring your own UI to telemetry data with Bronto and Lovable
Exposes Bronto's UI as an API for remixing, but Datadog, Grafana, and Kibana already offer custom dashboards.
Ship It
matiremi
113mo ago
Prometheus metrics rendered as cartoon faces—novelty visualization that's surprisingly readable for quick health scans.
DevOps, SREs, infrastructure teams wanting at-a-glance service health monitoring.
Grafana · Datadog dashboards · Kibana
Exposes Bronto's UI as an API for remixing, but Datadog, Grafana, and Kibana already offer custom dashboards.
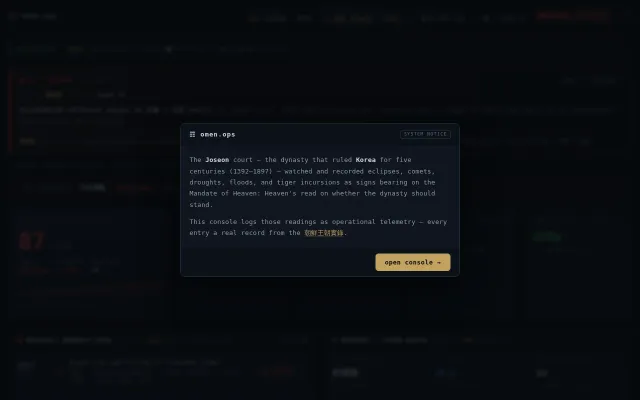
500 years of Korean court omens mapped to DevOps telemetry with real historical data.
eBPF kernel tracing lets you sniff Wi-Fi without monitor mode or disconnecting.
Finally tracks Claude Code spending across multiple machines when official tooling doesn't.
Cyberpunk visuals are fun, but LangSmith and Helicone already do agent monitoring better.
Instead of wrestling with raw mitmproxy output, this tool gives a purpose-built UI that shows system prompts, tool definitions, token accounting, streaming responses and tool calls — all in real time. The one-liner shell setup, keyboard shortcuts, and token breakdown make debugging Claude Code conversations startlingly quicker, though it’s inherently a local MITM (trust the generated CA) and is narrow by design to Anthropic’s workflow.