Data●Mid
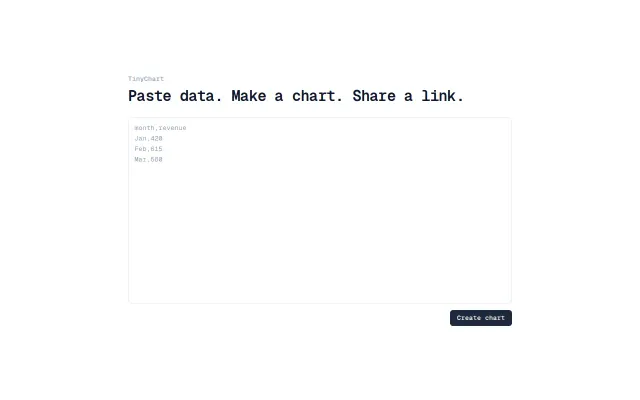
TinyChart. Paste CSV, get shareable chart. No accounts
QuickChart and Google Charts already do no-signup CSV-to-chart better.
Cozy
jordanf
743mo ago

Excel-to-dashboard automation, but Tableau and Power BI already do this better.
Small business owners, e-commerce sellers, multi-channel retailers
Tableau · Power BI · Metabase
I built a small tool that turns Excel files into dashboards automatically.
The idea came from seeing how many people still build reports manually in Excel every week. They export data, clean it, create charts, update them again the next week, etc.
So I built a simple workflow:
1. Upload an Excel file 2. The system analyzes the structure 3. It automatically generates dashboards and charts
The goal is to remove the repetitive part of reporting.
It’s not meant to replace BI tools like Power BI or Tableau, but rather to quickly generate visual dashboards from raw spreadsheets.
I’m currently testing the idea and would love feedback from the community: - What types of Excel reports do you generate most often? - What charts would you expect to be created automatically?
You can try it here: https://www.datanestanalytics.com/
QuickChart and Google Charts already do no-signup CSV-to-chart better.
Glide and Softr already turn spreadsheets into apps with more maturity.
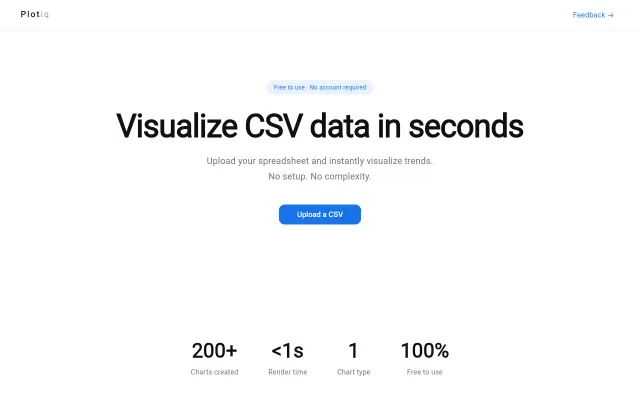
CSV to chart in seconds, but Plotly, Google Sheets, and Metabase already own this.
Static SVG charts in Markdown without JavaScript runtime, unlike Quarto or MkDocs.
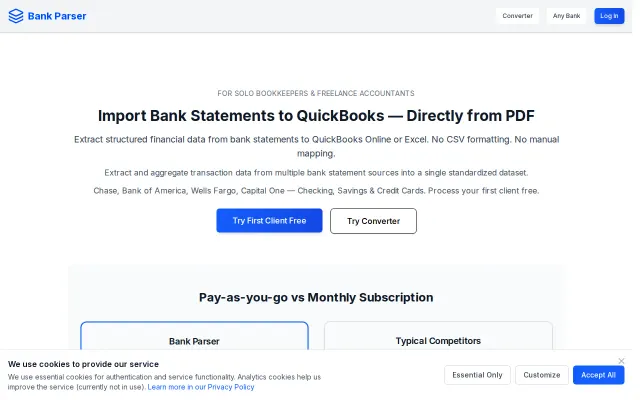
Bank-specific parsers beat generic OCR for QuickBooks imports.
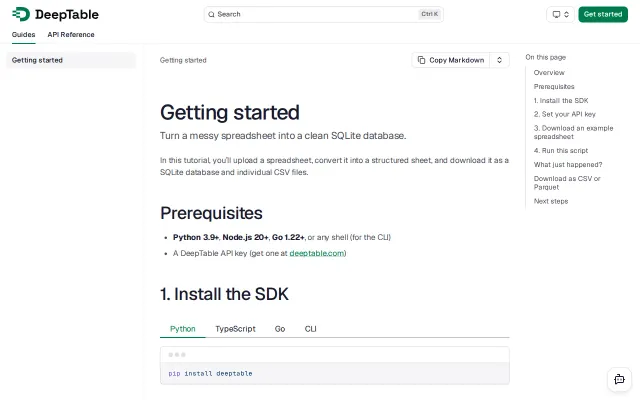
Agent-guided compilation handles merged cells and multi-level headers LLMs choke on.