Developer Tools●Mid
OmnySSH – TUI SSH manager with dashboard, SFTP and snippets (Rust)
Another SSH manager TUI when Termius and Tabby already dominate this space.
CozySlick
hartmann7
614d ago
Grafana dashboards in your terminal
Renders actual Grafana panels in your terminal when the web UI is just a tab switch away.
DevOps engineers and SREs who live in the terminal
Grafana CLI · k9s · lazygit
It renders the most common panel types (time series, bar charts, gauges, heatmaps etc.). You can change the time range, set dashboard variables and filter series.
I built this because I spend most of my day in the terminal and wanted a quick way to glance at dashboards without switching to the browser. It's not perfect by any means, but it's a nifty and useful tool.
Built with Go, Bubble Tea, ntcharts, and Claude (of course). You can install it via Homebrew:
brew install lovromazgon/tap/grafana-tui
... and try it out against Grafana's public playground:grafana-tui --url https://play.grafana.org
Another SSH manager TUI when Termius and Tabby already dominate this space.
Stats dashboard tracks human vs AI contributor split—timely feature delta and lazygit lack.
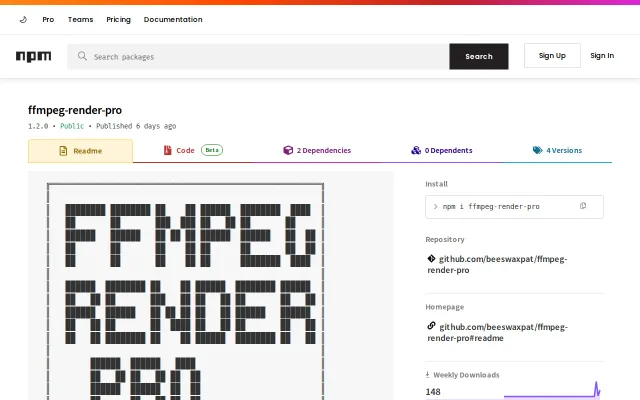
MCP server integration brings AI workflows to ffmpeg parallel rendering.
Cursor agent control panel, but Cursor.com UI already handles this in a browser.
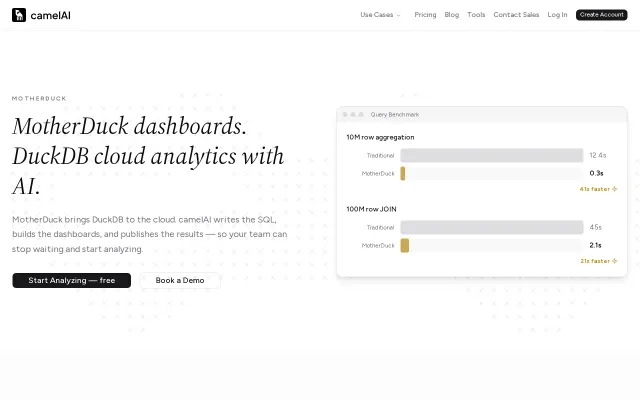
Generates native DuckDB SQL for MotherDuck instead of generic dialect.
Complete observability for AI coding assistants, but only supports three CLIs.