Education●●●Banger
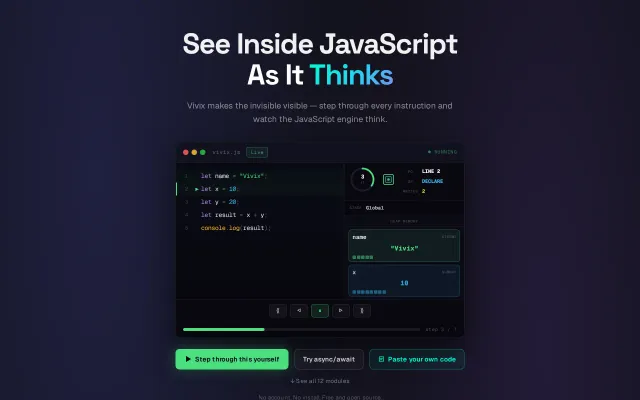
Vivix – See inside JavaScript as it executes (open source)
Event loop visualization with microtask and macrotask queues finally makes async legible.
Eye CandyCrowd PleaserZero to One
hlude
471mo ago
Visualizes pointer movement in trees for your code, unlike Python Tutor.
Software engineers preparing for technical interviews
Python Tutor · VisuAlgo · LeetCode
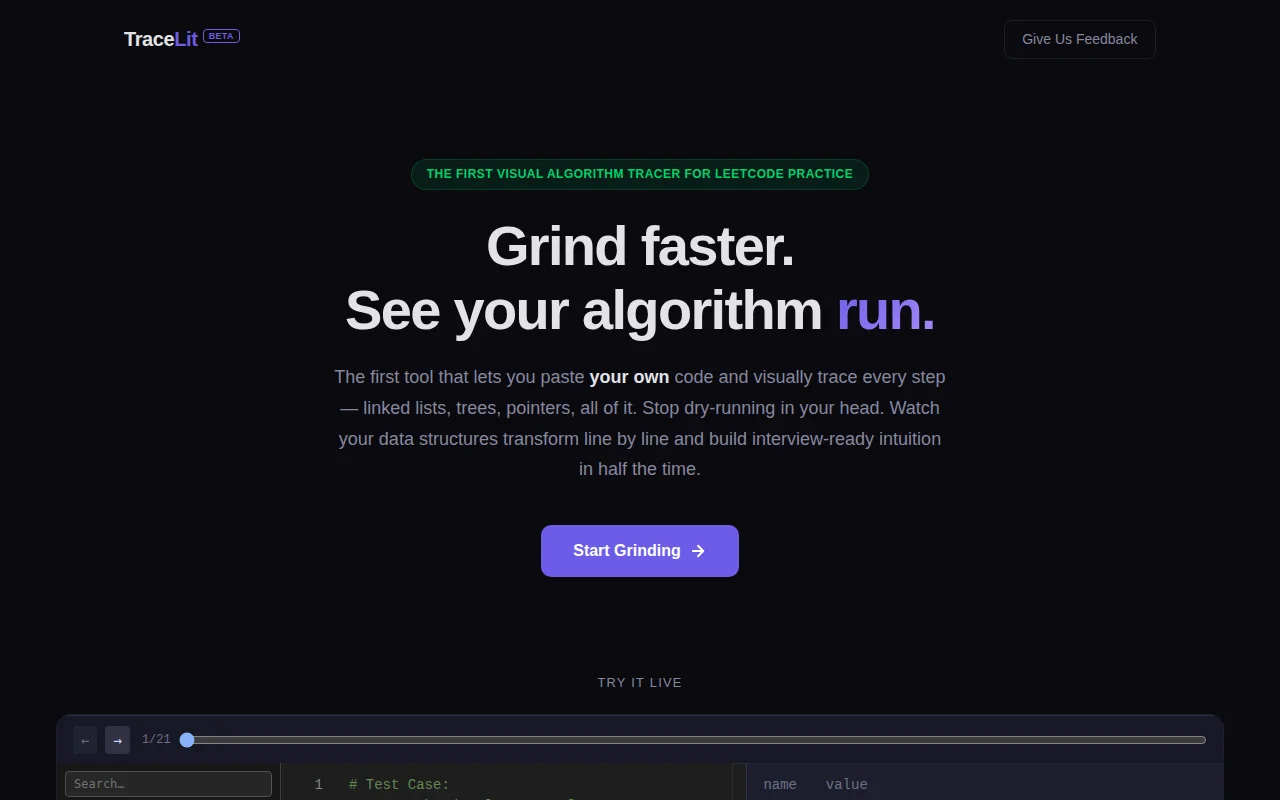
You paste code and input, run it, and step through execution line by line. It helps you see variable changes, control flow, and where things start going wrong.
It’s especially useful for recursion, trees, linked lists, and simulation-style problems.
You can try it here: https://tracelit.dev No signup required.
I’d love feedback on which problem types this feels most useful for, and what feels confusing.
Event loop visualization with microtask and macrotask queues finally makes async legible.
Breakpoints and interactive shell for GitHub Actions when act only gives you log dumps.
GDB trace debugging for FORTH, but it's a workflow demo without reusable tooling.
DAP implementation for Python, but debugpy and Pdb already handle this.
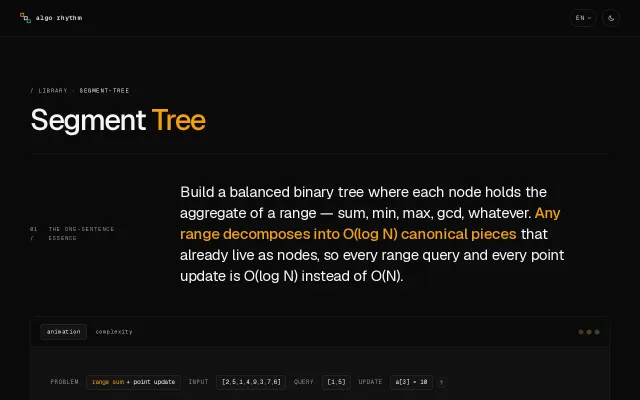
Canonical piece decomposition visualization makes O(log N) queries actually click.
Visual approval gates for AI agents before code writes—Claude/Cursor integration ready.