Productivity●Mid
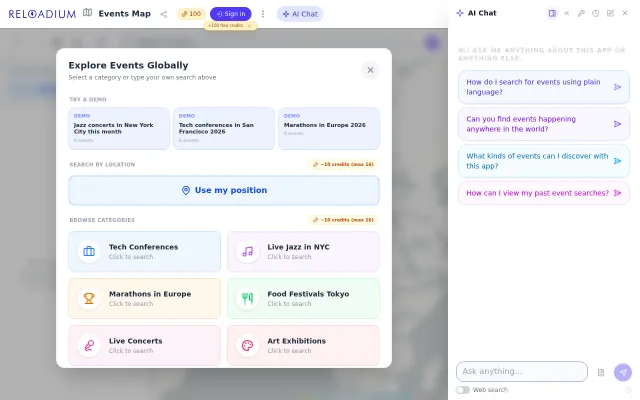
Hackamaps – A global hackathon map I build after hitting Lovable Limits
Yet another event aggregator with no automated data ingestion.
Ship It
ostenjap
312mo ago
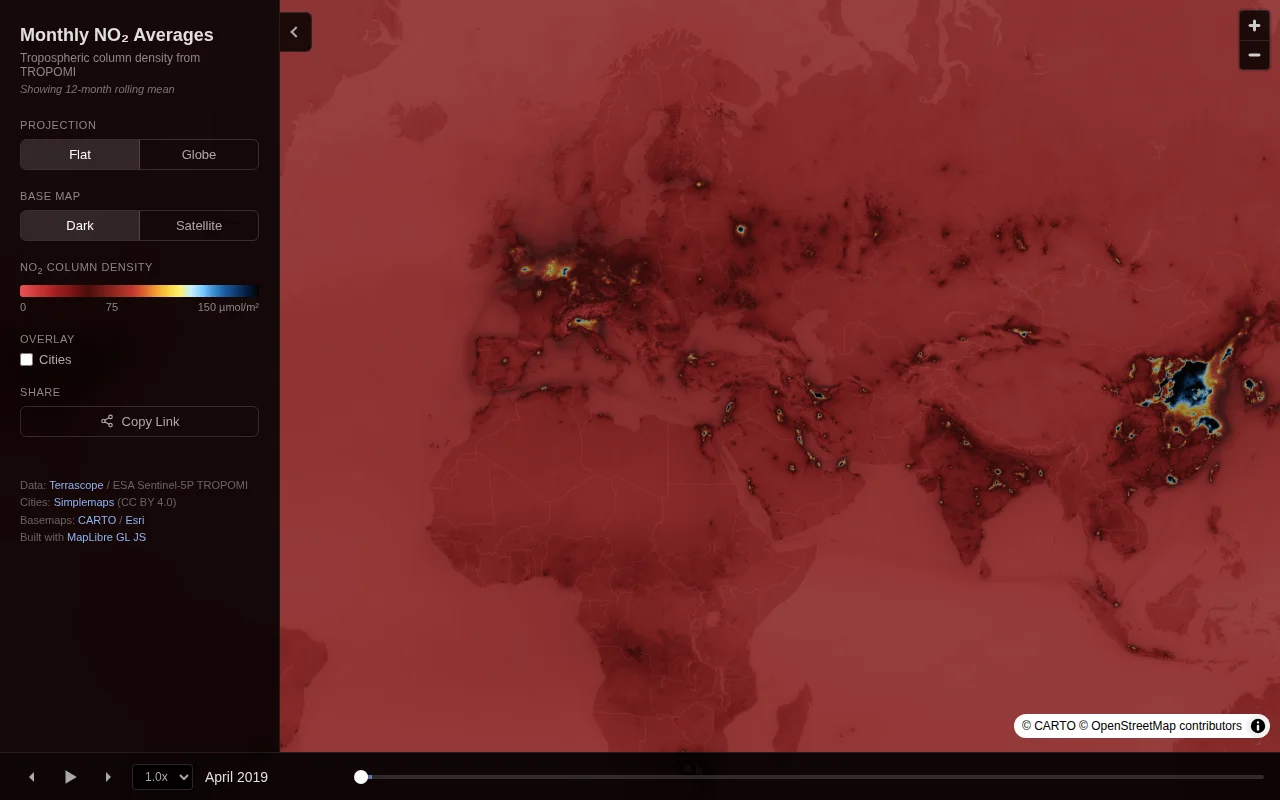
12-month rolling mean with time scrubbing reveals pollution patterns from 2019 to present.
Environmental researchers, data visualization enthusiasts, educators
NASA Worldview · Google Earth Engine · Copernicus Browser
Yet another event aggregator with no automated data ingestion.
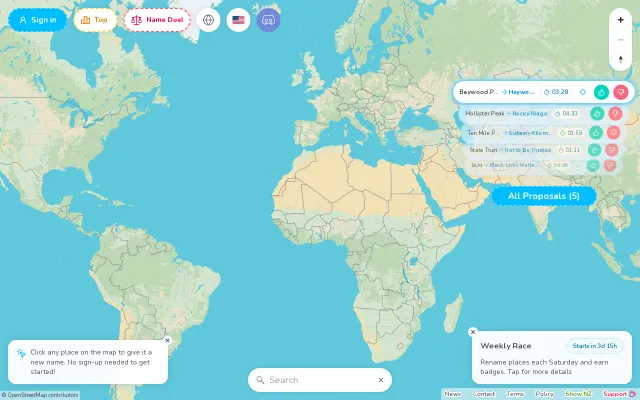
Crowdsourced place-naming reaches 40k renames without turning into total chaos.
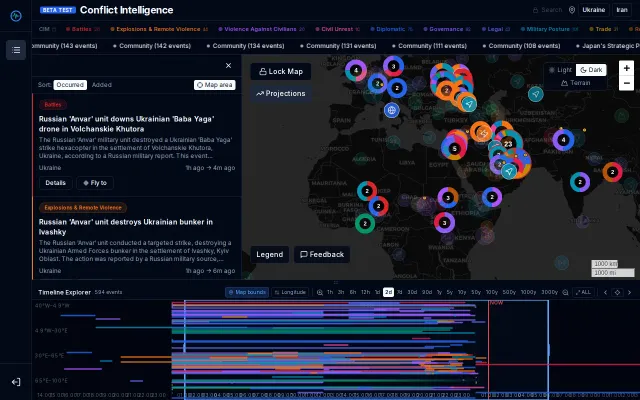
Automated storytelling mode flies you through events with voice-over narration.
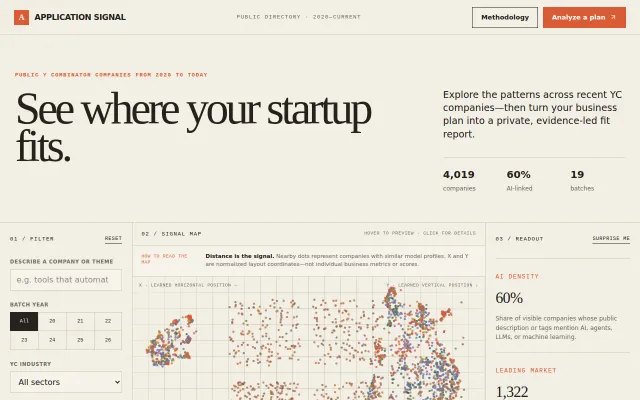
YC startup map with vector similarity clustering beats manual Crunchbase filtering.
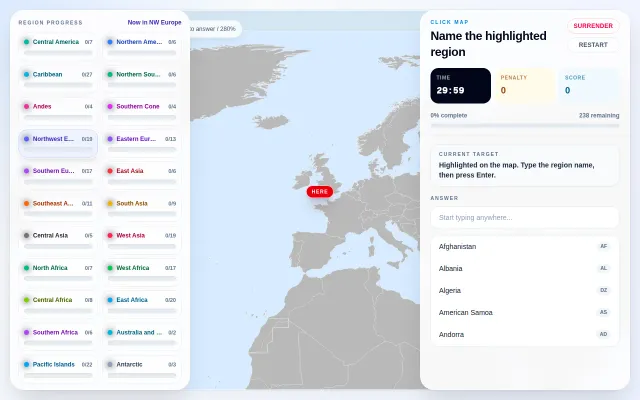
Fun geography drill, but Seterra and Worldle already dominate this space.
AI chat wrapper for event search when Eventbrite and Meetup already do this better.