Data●●Solid
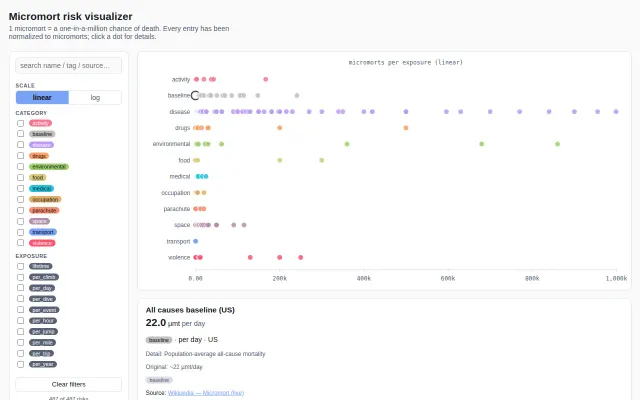
Micromort Risk Visualizer
Sorting 487 risks by danger level is a genuine rabbit hole for the statistically anxious.
Rabbit HoleCozy
boxed
501mo ago
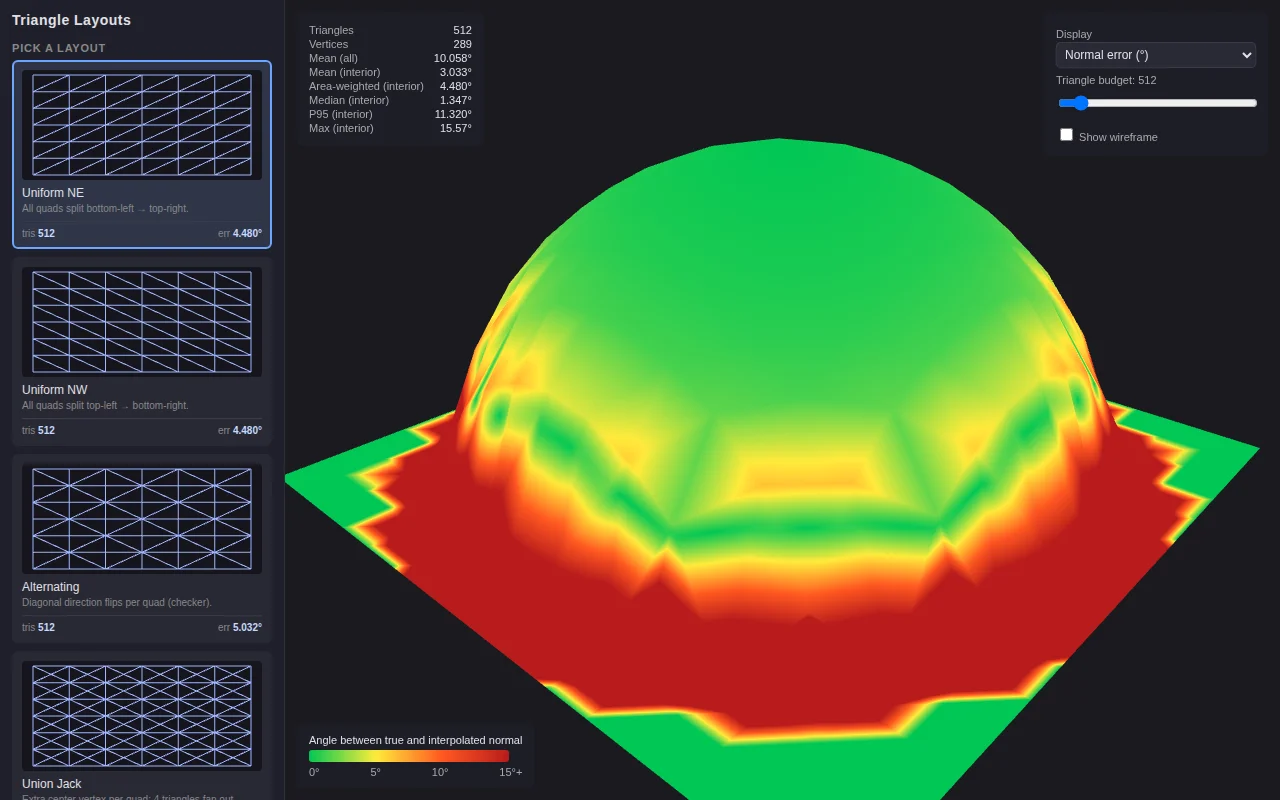
Visual proof that McGuire's 2005 isometric grid beats standard quad-splitting for normal interpolation.
Graphics programmers, game engine developers, GIS specialists
Houdini · Blender Geometry Nodes · Three.js Editor
Sorting 487 risks by danger level is a genuine rabbit hole for the statistically anxious.
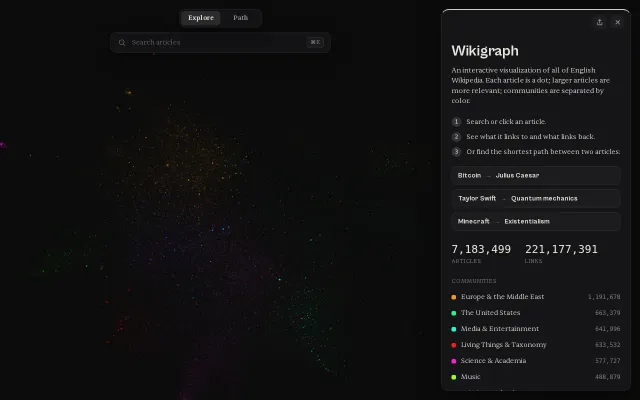
GPU-accelerated layout renders 7M articles with shortest-path finding between any two.
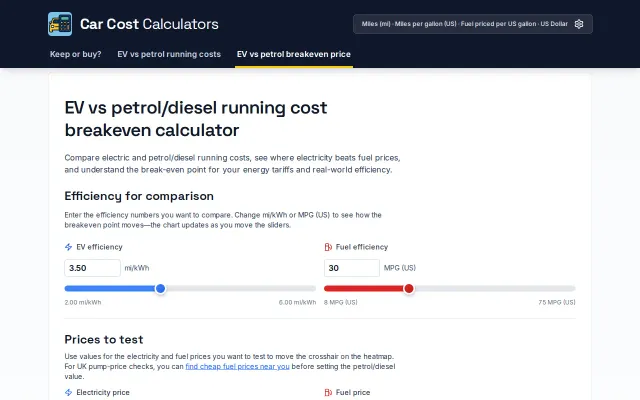
Heatmap visualization makes EV breakeven costs clearer than standard static calculators.
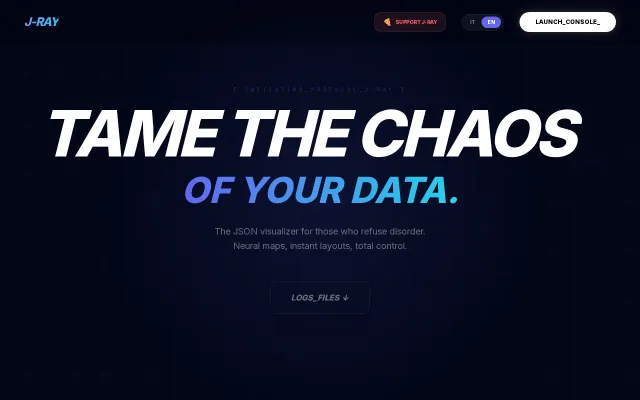
Slick JSON-to-graph visualizer; privacy wins but Noctua, JSONCrack already exist.
Makes queue latency tradeoffs visible in seconds—great for architecture reviews and postmortems.
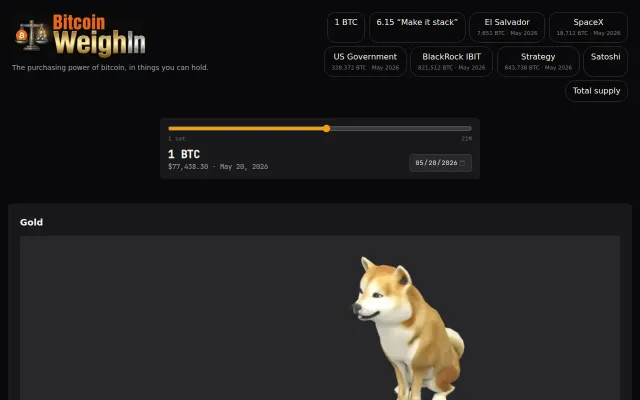
Sliding scale from 1 sat to 21M BTC with a working Geiger counter for plutonium.