Data●Mid
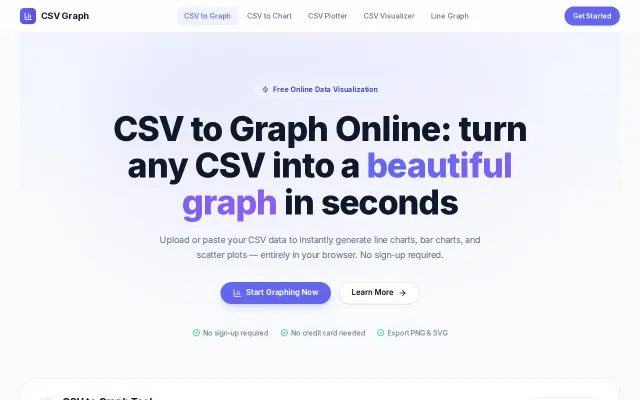
CSV Graph – create charts from CSV files in the browser
Clean CSV charting, but Datawrapper and Google Sheets already do this free.
CozySlick
lfdev
834d ago
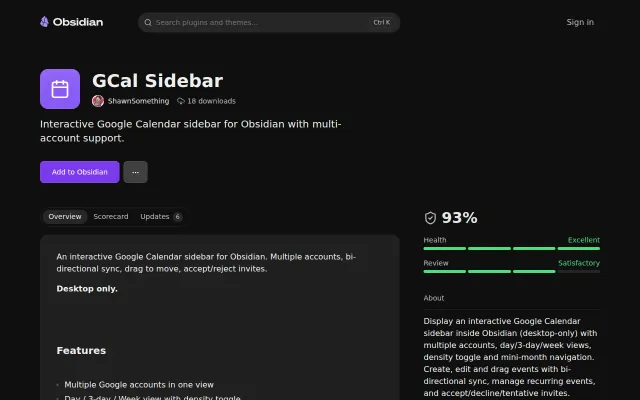
Obsidian plugin adding highly customizable and native-feeling chart layout to Bases. Built with pure SVG and zero dependencies.
Charts that actually feel like Obsidian core features, not heavy web-views slapped on.
Obsidian users, knowledge management enthusiasts
Obsidian Dataview · Charts plugin · Notion databases
I've built a plugin for Obsidian that adds lightweight, highly customized, and native-feeling chart layouts (Bar, Line, Pie) specifically for the new database-like "Bases" feature.
Repository: https://github.com/zobweyt/obsidian-bases-chart-layouts Plugin page: https://community.obsidian.md/plugins/bases-chart-layouts
### The Problem
I needed a way to visualize my structured note data in Obsidian without the bloat. Existing chart solutions either required writing complex JavaScript inside codeblocks or felt like heavy web-views slapped onto the app.
I wanted charts that feel like a built-in, core feature of Obsidian—lightweight, snappy, and deeply integrated with the UI.
### What makes it "Native-Feeling"
It goes beyond basic SVG rendering to mimic Obsidian’s native desktop UX patterns:
- *Interactions:* Full support for `cmd/ctrl + click` and middle-click (`auxclick`) to open underlying data files in new tabs or split panes. - *Context Menus:* Right-clicking the chart triggers native Obsidian context menus, not generic browser ones. - *Theme Adaptation:* It doesn't just switch light/dark modes. It dynamically inherits your exact Obsidian theme CSS variables and fonts.
### Tech Stack & DX
I wanted to keep the codebase as clean as the UI:
* *No Node/NPM Boilerplate:* The entire project is built purely with Deno (fmt, lint, build). This kept the development environment exceptionally lightweight and fast. * *Rendering:* Powered by Apache ECharts under the hood for crisp vector rendering. The final plugin size is only ~1MB. * *I18n:* Built-in localization support (currently English and Russian).
### How to try it
1. Ensure you have Bases enabled in Obsidian. 2. Add a chart layout to your view. 3. Map your columns using the native Properties panel.
I’d love to hear your thoughts on the UX integration, and especially on using Deno for building Obsidian plugins. Any feedback or feature requests are welcome!
Clean CSV charting, but Datawrapper and Google Sheets already do this free.
Faithful fan recreation of Scoundrel, but browser card games are a crowded category.
Bi-directional sync inside Obsidian without third-party servers.
Client-side data tools without signup, but Papaparse and a dozen alternatives already solve this.
Yet another trading sim, but the MEXC affiliate link kills the vibe.
Yet another AI ad generator competing with Predis and AdCreative in a crowded space.