AI/ML●●●Banger
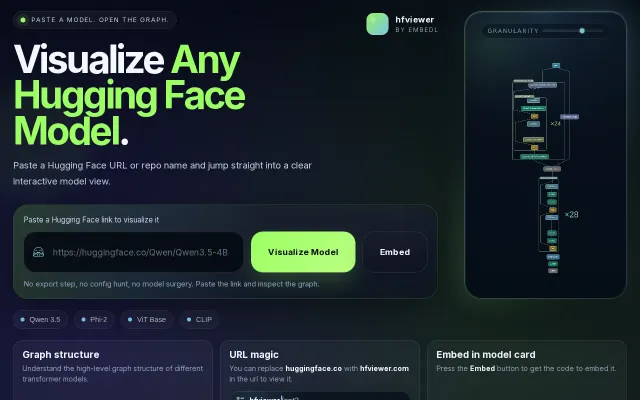
HF viewer – visualize any Hugging Face model
Paste any HF URL to instantly see the full transformer architecture graph.
Eye CandyRabbit HoleWizardry
vottivott
502mo ago
It surfaces slow and errored endpoints directly in your editor and correlates metrics→traces→profiles so you can jump to the offending function with a module/function heat‑map. That flow — bringing observability context into the code and showing where time is actually spent — is a smart, high-leverage move; the real test will be how accurately it maps noisy production signals across Loki/Tempo/Prometheus/Pyroscope in diverse stacks.
Backend developers, SREs, DevOps and observability engineers
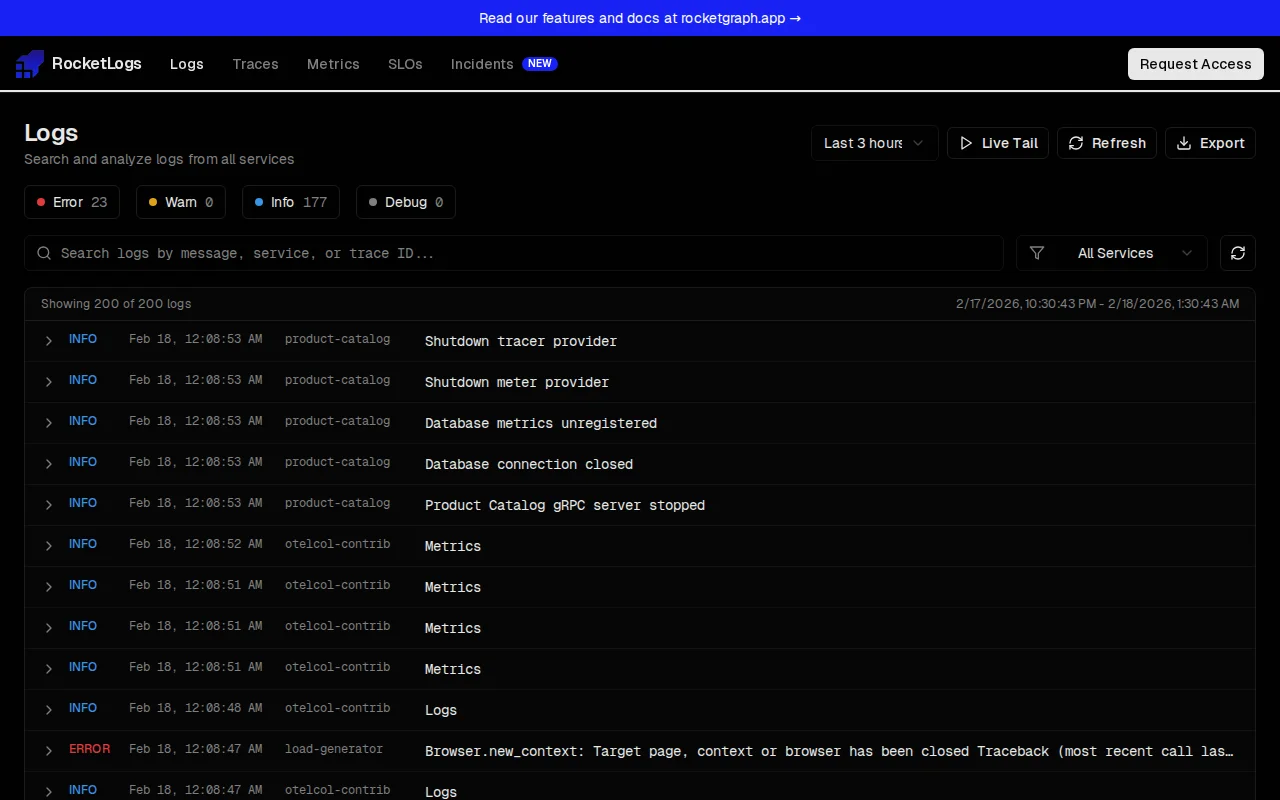
The problem I kept running into: you get paged at 3 AM, open Grafana, flip between six dashboards, grep through logs, try to figure out which deploy went out, and an hour later you maybe have a root cause. You still need to dig through code and find the culprit. The data is all there, but nothing connects it for you.
RocketLogs tries to fix that:
VS Code / Cursor Extension - Fetches your slow and errored-out endpoints from production and lists them right in the Cursor chat sidebar with their latencies. It maps them to your codebase using Pyroscope profiling. So you have metrics -> traces -> profiles -> code right inside the codebase. It shows latency and a heat-map of how much your modules/funcs are bleeding your endpoints. So you can jump to the offending function and fix it without context-switching and within minutes.
Beyond those, it's a full observability stack: log search, distributed tracing with waterfall views, SLOs with error budget tracking, incident management with AI-generated synopses, smart alerts, and Prometheus dashboards.
We're built on the LGTM stack, so if you're already sending data to Loki/Tempo/Prometheus, you can point RocketLogs at your existing infrastructure. Using this as essentially another observability layer that sits on top. If you want to use multiple vendors, you can also do a telemetry fan-out.
Would love feedback. What's the most painful part of your current observability workflow?
Paste any HF URL to instantly see the full transformer architecture graph.
Yet another package proxy when Sonatype, Verdaccio, and Cloudsmith already own this space.
AI memory layer when mem0 and LangMem already own this category.
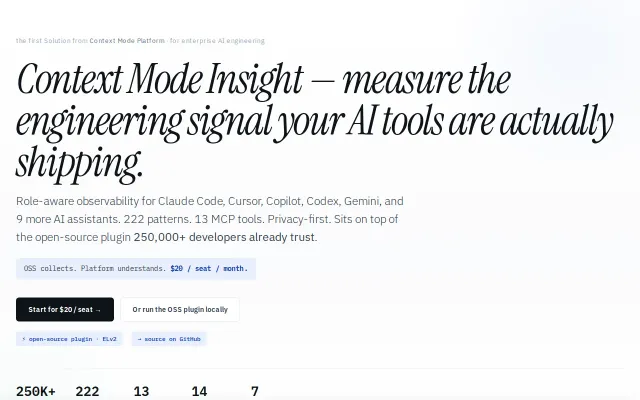
250K users on OSS plugin, now measuring AI coding ROI for teams.
Proxying every LLM call to log tokens is the right kind of blunt instrument — you get per-developer, per-model cost telemetry immediately. Smart routing and the built-in semantic cache (claims 45–80% savings) are the most useful ideas here, but the default SQLite backend and admin/admin creds scream MVP rather than production-ready scale.
Another spec framework competing with GitHub's spec-kit but as a skill file.