Infrastructure●●Solid
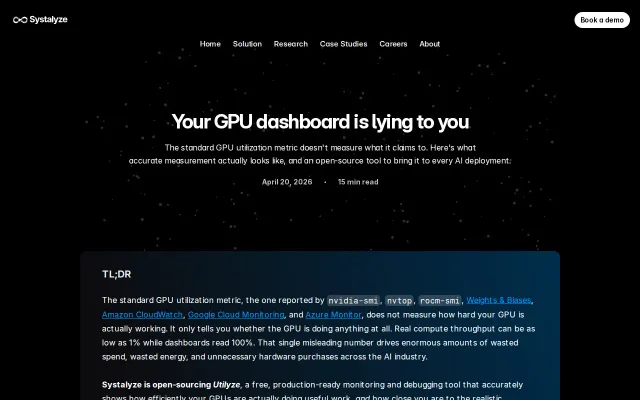
Utilyze, an open source GPU monitoring tool more accurate than nvtop
Throughput-based GPU metrics expose 1% real utilization when nvtop reports 100%.
Big BrainSolve My Problem
ManyaGhobadi
128281mo ago
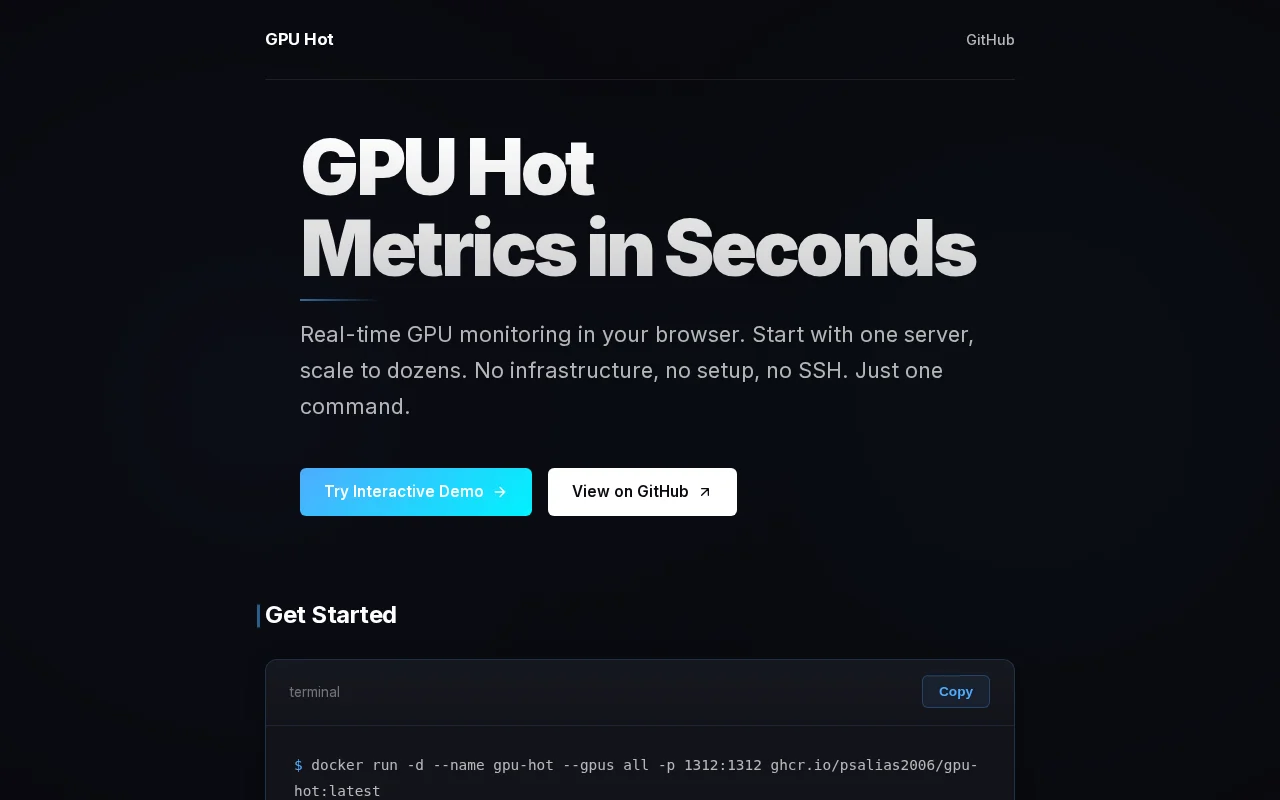
Shoots for zero-setup GPU visibility: one docker run spins up a service you open in the browser to see live NVIDIA metrics without Prometheus, SSH, or dashboards to configure. The UI and interactive demo show attention to UX and make it instantly useful for small clusters or single-node setups. It doesn’t reinvent observability — if you need long-term metrics, alerting, or enterprise integrations you’ll still reach for exporters + Grafana — but for lightweight, immediate GPU troubleshooting this is convenient and focused.
ML engineers, DevOps / SREs, researchers and anyone who manages remote NVIDIA GPU servers
Throughput-based GPU metrics expose 1% real utilization when nvtop reports 100%.
MSI Afterburner for Linux—finally per-point V/F curve control where nothing existed before.
Granular API key controls and token cost tracking beat basic llama.cpp wrappers.
Claude talks to RunPod/Lambda/Lambda/Vast — but needs working provider integrations to matter.
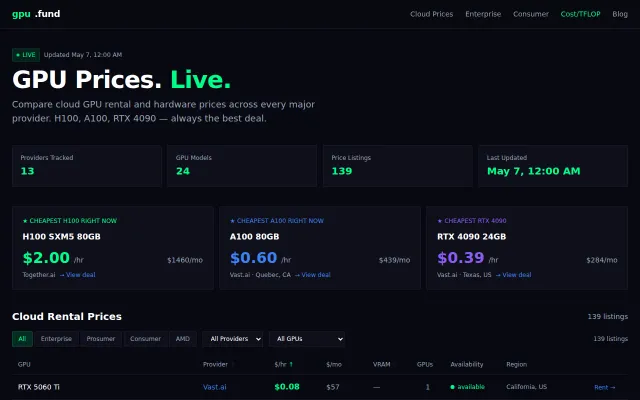
Finally a single tab to check H100 prices instead of opening ten provider dashboards.
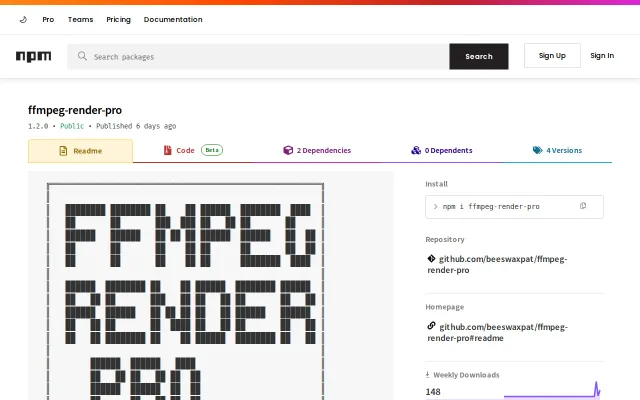
MCP server integration brings AI workflows to ffmpeg parallel rendering.