Developer Tools●Mid
OpenCode Benchmark Dashboard
Benchmarks OpenCode models locally, but lacks preloaded datasets and only works with configured OpenAI-compatible APIs.
Niche Gem
grigio
103mo ago
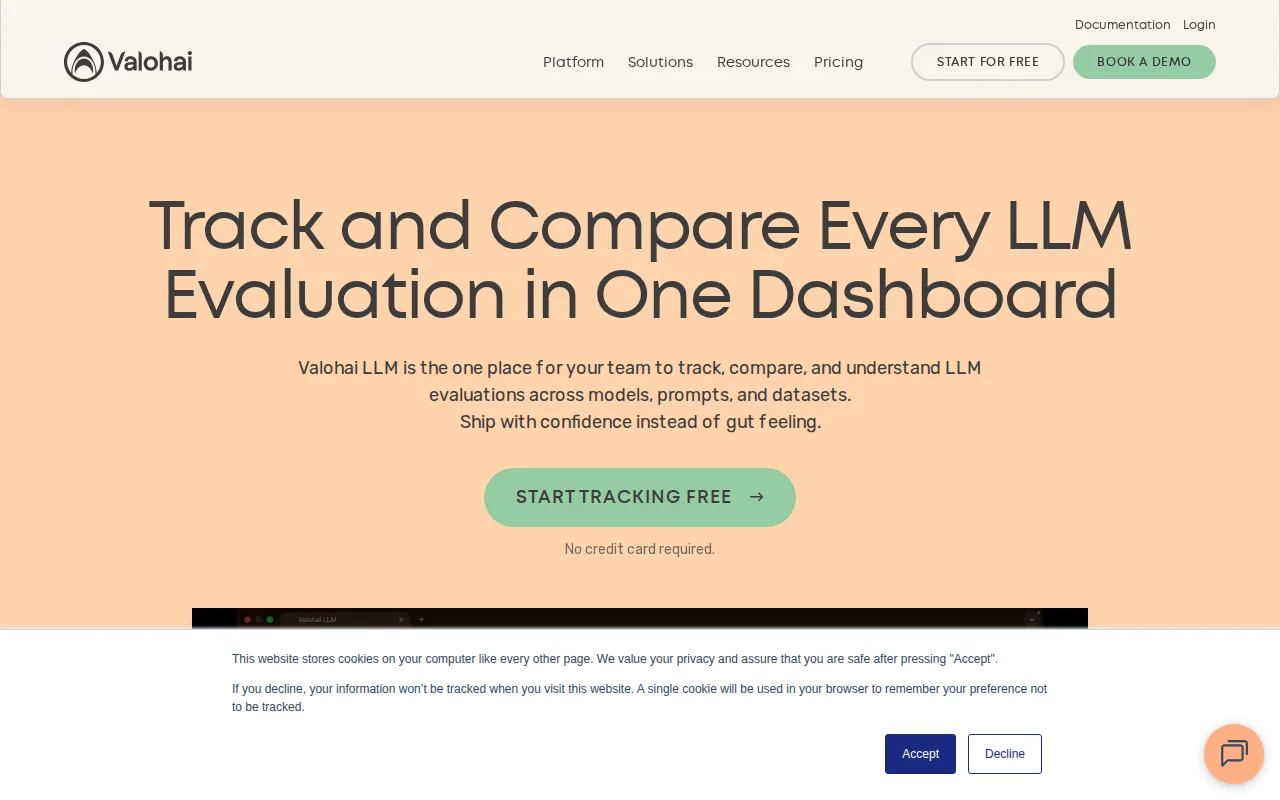
Streams evals from a tiny Python client into a shared dashboard and lets you run parameter sweeps and compare up to six configurations with radar/bar charts and scorecards — exactly the sort of tooling that stops results getting lost in notebooks. Useful, pragmatic product for teams who repeatedly evaluate models, but it's competing with general observability/experiment trackers (W&B, Neptune) and will need strong integrations and metric flexibility to stand out.
ML engineers, MLOps teams, data scientists and evaluation-focused researchers
Run evals with a Python library (pip install valohai-llm), results stream in, and you can compare up to 6 configurations side by side. Group by any dimension (model, category, difficulty) to see where each model excels.
It doesn't do tracing or production observability, for now just eval tracking and comparison. What's cool is that you can define parameters you would like to test with and run a sweep across all of them.
Feedback welcome, especially from anyone comparing models and evaluating regularly!
Benchmarks OpenCode models locally, but lacks preloaded datasets and only works with configured OpenAI-compatible APIs.
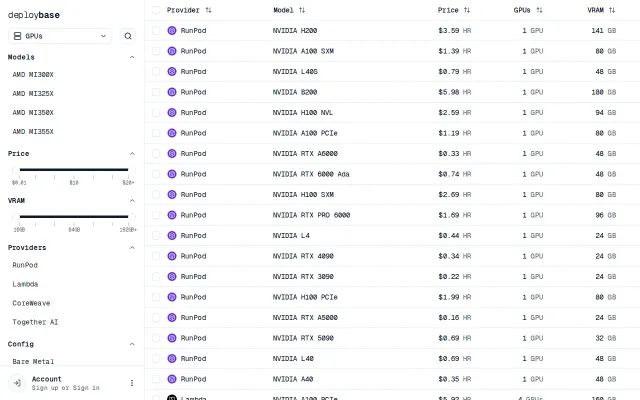
Real-time GPU pricing aggregator, but existing tools like Crusoe Dashboard already solve this.
Phoenix LiveView embedding beats switching to LangSmith for Elixir teams.
Schema conformance checks beat generic text evals for JSON-heavy LLM pipelines.
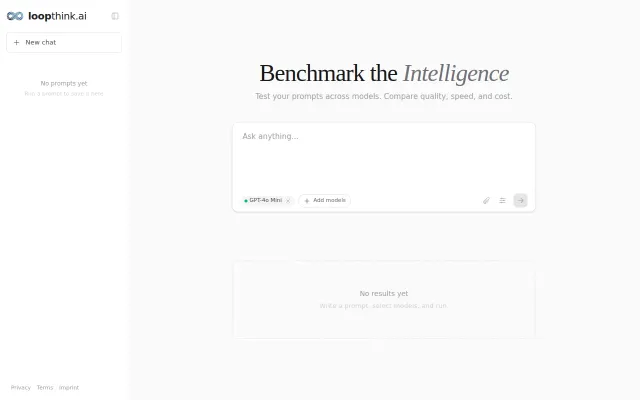
Kills the copy-paste workflow, but model comparison UIs already exist elsewhere.
Yet another prompt benchmarking UI when Promptfoo and LangSmith already exist.