Data●Mid
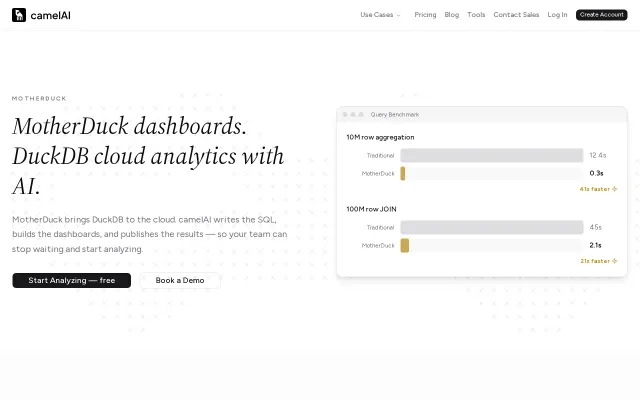
Connect MotherDuck and build dashboards with AI-generated DuckDB SQL
Generates native DuckDB SQL for MotherDuck instead of generic dialect.
Solve My Problem
bellareed
202mo ago
SQL dashboards in React without backend, but Retool and Metabase solve this more maturely.
Frontend developers building analytics dashboards, data analysts, product teams
Retool · Metabase · Superset
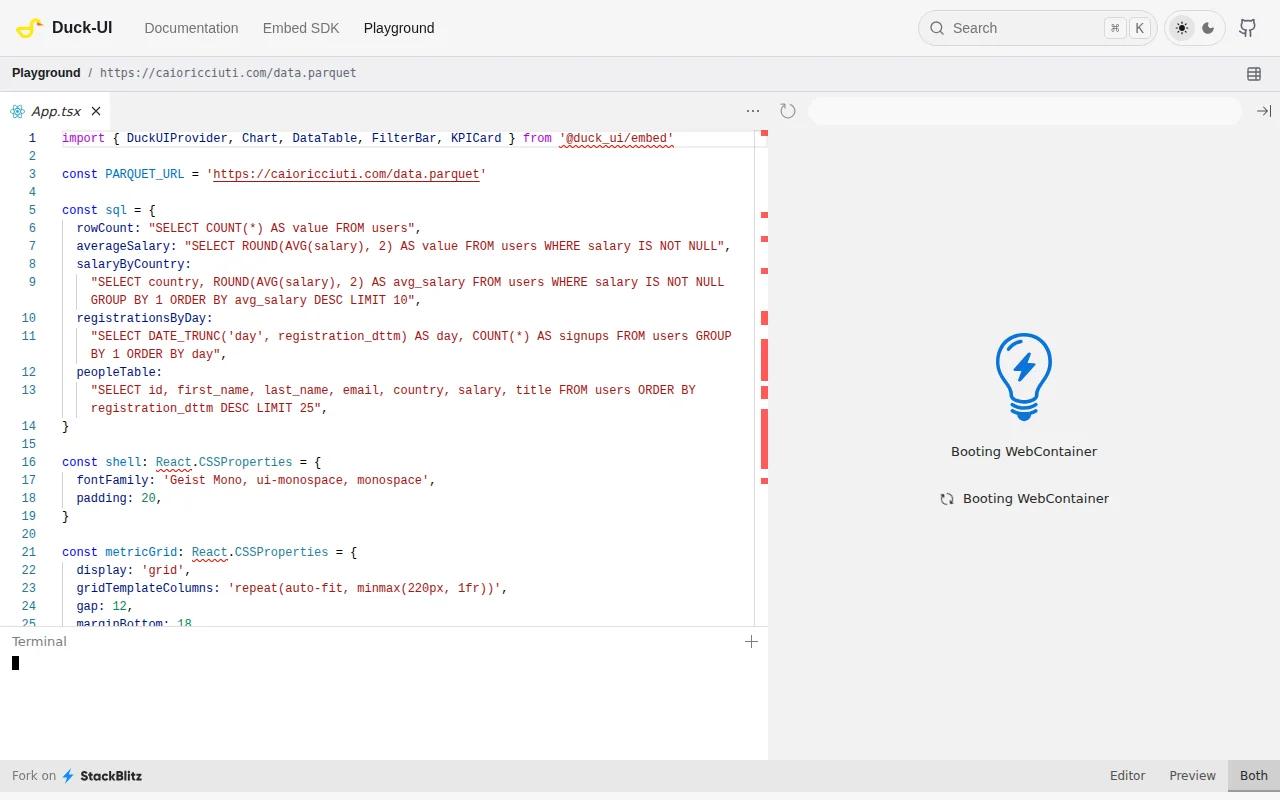
I built @duck_ui/embed — a set of React components that turn SQL queries into interactive dashboards, powered by DuckDB-WASM running entirely in the browser.
`npm install @duck_ui/embed @duckdb/duckdb-wasm`
The idea: pass your data (arrays, CSV, Parquet, JSON, or a fetch callback), write SQL, and get charts, tables, KPIs, and filters — no backend required.
<DuckUIProvider data={{ sales: { url: "/sales.parquet", format: "parquet" } }}> <Dashboard columns={3}> <Dashboard.Panel> <KPICard sql="SELECT sum(revenue) as value FROM sales" label="Revenue" format="currency" /> </Dashboard.Panel> <Dashboard.Panel span={2}> <Chart sql="SELECT month, sum(revenue) FROM sales GROUP BY 1" type="bar" /> </Dashboard.Panel> <Dashboard.Panel span={3}> <DataTable sql="SELECT * FROM sales" pageSize={20} sortable /> </Dashboard.Panel> </Dashboard> </DuckUIProvider>
What's under the hood:- DuckDB-WASM boots in the browser, data loads into in-memory tables - SQL queries run against real DuckDB (full SQL support, window functions, CTEs) - Parquet files use HTTP range requests — only fetches needed row groups - FilterBar auto-detects column types and injects WHERE clauses via subquery wrapping - Connection pool (max 4), LRU query cache (100 entries, 5min TTL) - ~95KB bundled (ESM), tree-shakeable
Components: Chart (line/bar/area/scatter/pie), DataTable (paginated, sortable, resizable columns), KPICard (with sparkline + comparison), FilterBar (auto or manual config), Dashboard (responsive grid layout), ExportButton (CSV/JSON).
For connecting to external databases (Postgres, MySQL, etc.), there's a "gateway pattern" — your backend runs the SQL and returns JSON, the embed renders it via a fetch callback.
Built with: React 18+, DuckDB-WASM, uPlot, @tanstack/react-table, Zustand. Apache-2.0 licensed.
Live playground: https://duckui.com/play Docs: https://duckui.com/embed/docs npm: https://www.npmjs.com/package/@duck_ui/embed
This is part of the Duck-UI project (https://github.com/ibero-data/duck-ui), a browser-based SQL IDE for DuckDB with 525+ stars. The embed SDK lets you take the same DuckDB-powered analytics and drop them into any React app.
Would love feedback on the API design and what components/features you'd want next.
Generates native DuckDB SQL for MotherDuck instead of generic dialect.
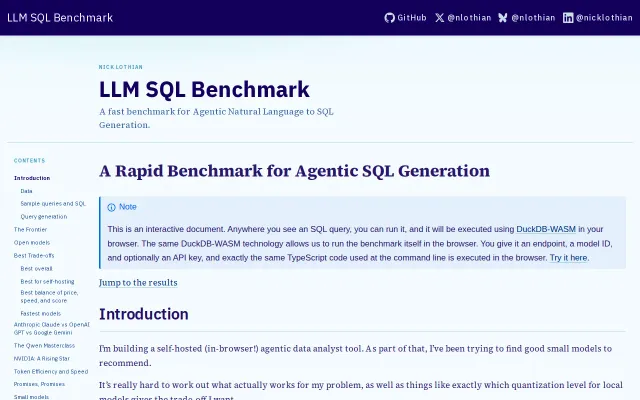
Interactive DuckDB-WASM benchmark beats static leaderboards for agentic SQL eval.
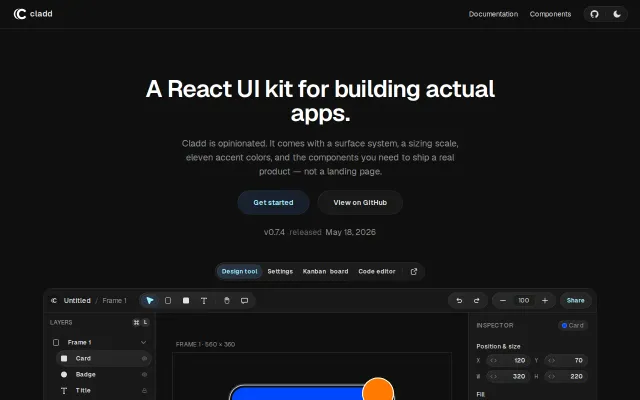
Surface system auto-bumps depth levels for nested panels without manual z-index management.
DuckDB-Wasm runs SQL queries on dropped files directly in your browser, no server needed.
React components handle Gmail and Outlook quirks so you don't have to.
DuckDB-Wasm in browser with shareable URLs—better than opening Python.