Finance●Mid
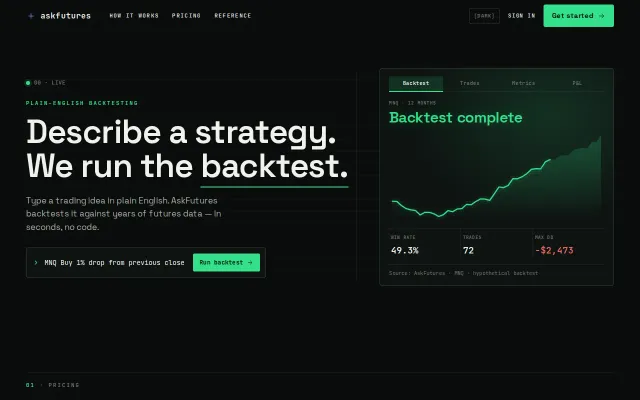
Backtest a futures strategy described in plain English
Plain English backtesting when QuantConnect and TradingView already exist.
SlickSolve My Problem
jmulla
5121d ago
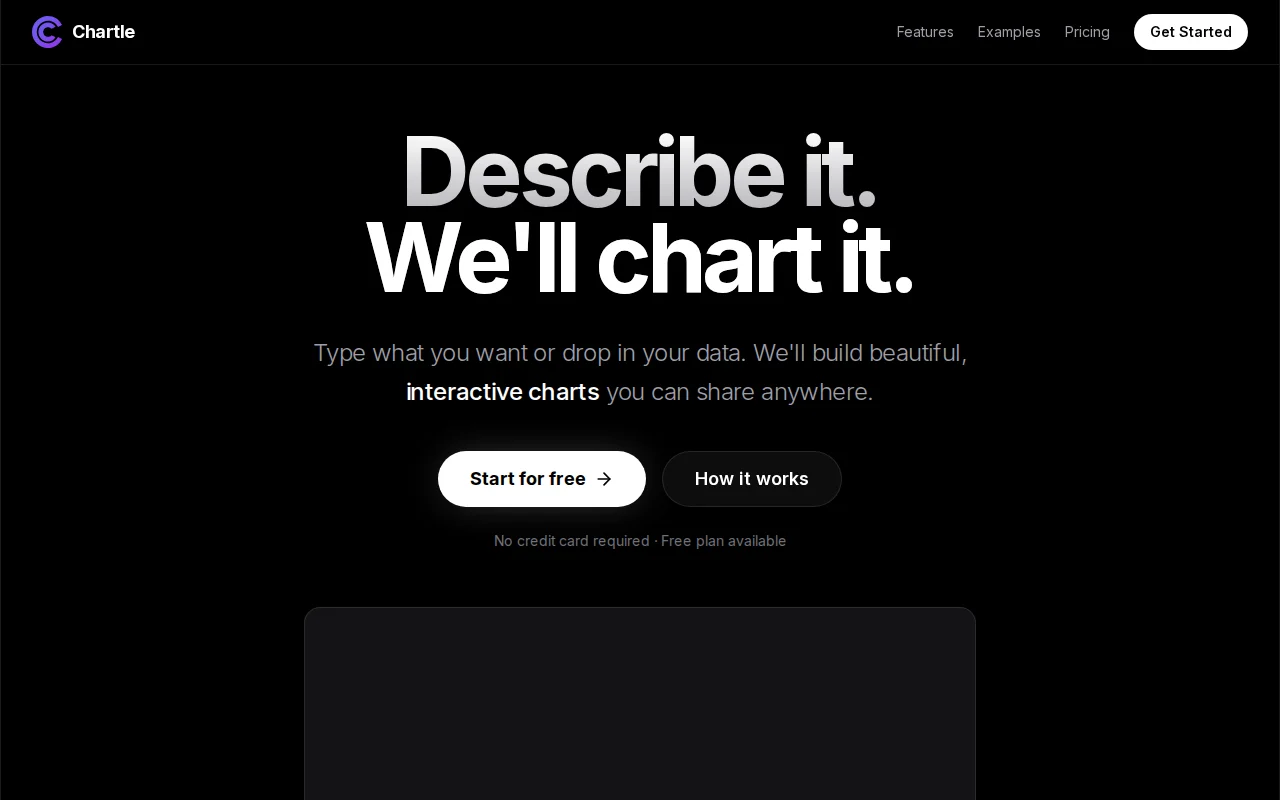
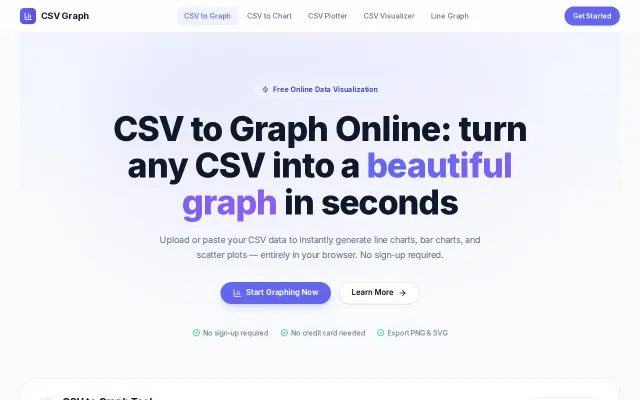
LLM + web search for chart generation, but Canva, Google Sheets, and Datawrapper already own this.
Non-technical analysts, marketers, students, journalists, anyone creating data visualizations
Canva · Google Sheets · Datawrapper
Built with Next.js/TypeScript, Gemini with Google Search grounding for data retrieval, and ECharts for rendering.
Free to try, no signup needed for your first chart. Free tier gives you 5 charts/month.
Plain English backtesting when QuantConnect and TradingView already exist.
First MCP app with interactive fitness UI, but only useful to Garmin+Claude users planning races.
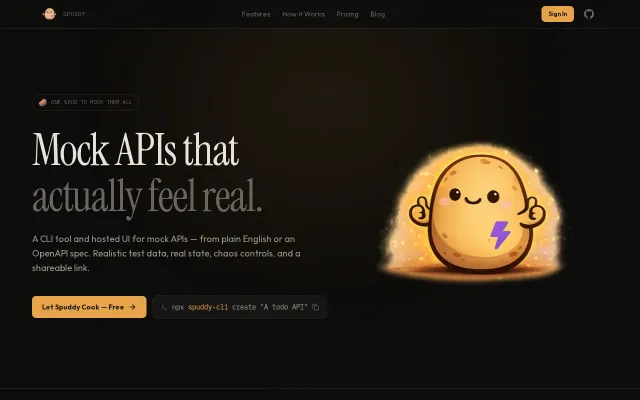
Natural language to live API in 14 seconds with chaos injection and team share links.
Clean CSV charting, but Datawrapper and Google Sheets already do this free.
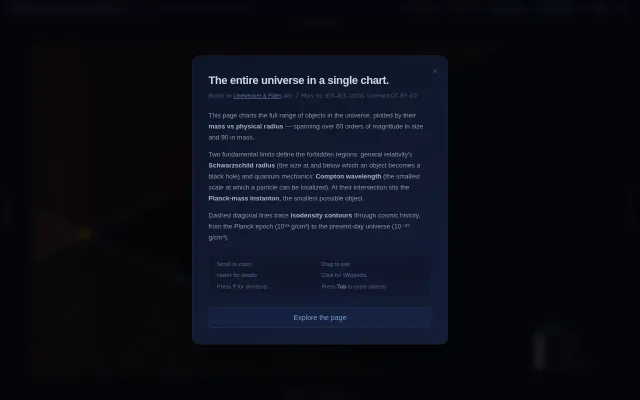
60 orders of magnitude in one scrollable chart with Wikipedia deep-links.
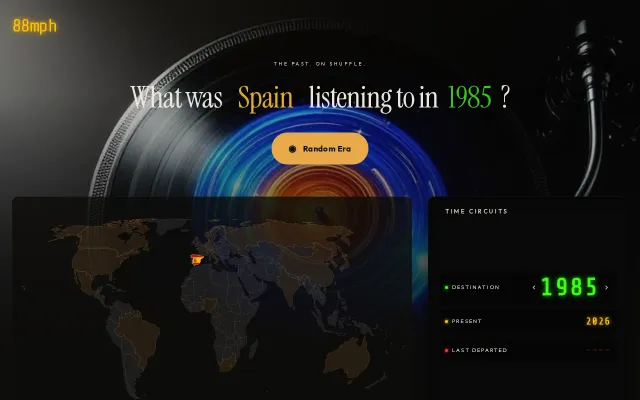
Explore 230 global music charts from 1940–2025 with a Back to the Future UI.