Finance●Mid
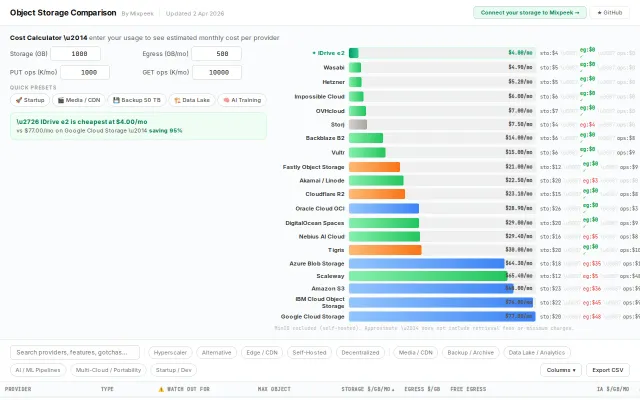
Interactive object storage cost calculator
Cloud cost calculators exist everywhere — this one just covers more providers.
Solve My Problem
Beefin
202mo ago
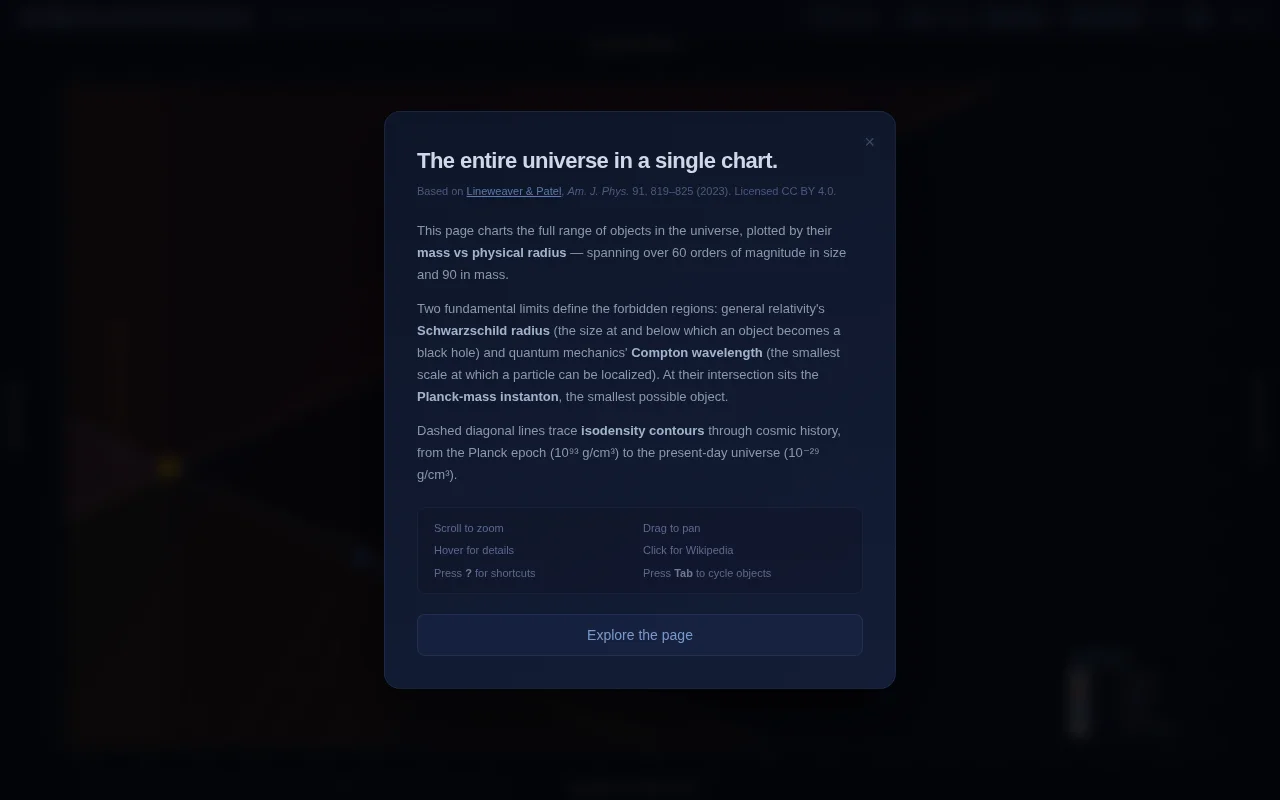
60 orders of magnitude in one scrollable chart with Wikipedia deep-links.
Science enthusiasts, educators, physics students
Scale of the Universe · The Size of Space · Nano-Cell
This was an experiment in extending the utility of a science infographic via hyperlinks, navigability and tooltips that detail the meaning of specific parts.
There are likely still spatial/numerical issues, happy to take corrections.
The original paper: https://pubs.aip.org/aapt/ajp/article/91/10/819/2911822/All-...
Cloud cost calculators exist everywhere — this one just covers more providers.
First MCP app with interactive fitness UI, but only useful to Garmin+Claude users planning races.
GPU-accelerated immediate-mode plotting for ImGui users tired of hacking Matplotlib.
LLM + web search for chart generation, but Canva, Google Sheets, and Datawrapper already own this.
On-chain HN clone promising universal income without clear tokenomics or liquidity.
Grammar of graphics in CLI form when Vega-Lite and ggplot2 exist.