Design●●Solid
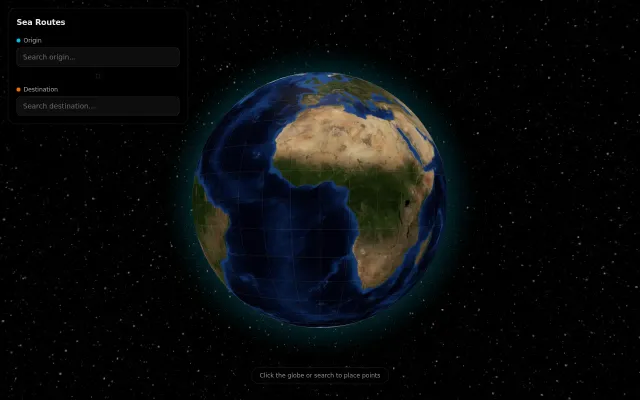
Interactive 3D WebGL Globe for real-time daylight cycles
Pretty globe, but Google Maps 3D, Mapbox, and Globe.gl demos already exist.
Eye CandyRabbit Hole
codechibi
554mo ago
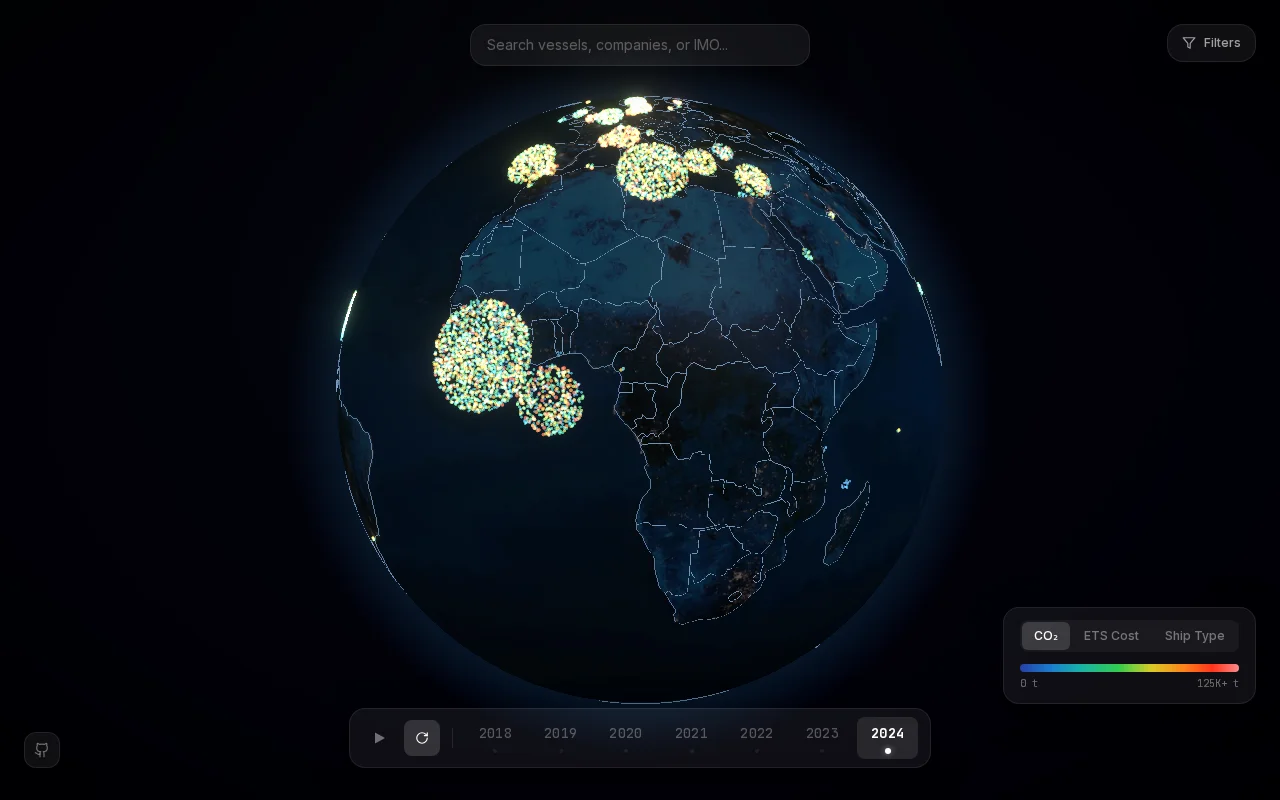
Gorgeous 3D emissions viz, but data exploration tools like THETIS already exist.
Environmental researchers, shipping industry analysts, policy makers
THETIS-MRV official portal · Global Fishing Watch · MarineTraffic
Pretty globe, but Google Maps 3D, Mapbox, and Globe.gl demos already exist.
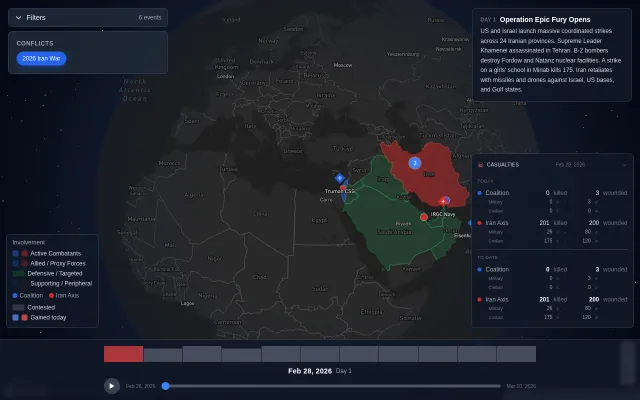
Combat-only focus is cleaner than Liveuamap, but data verification pipeline remains unclear.
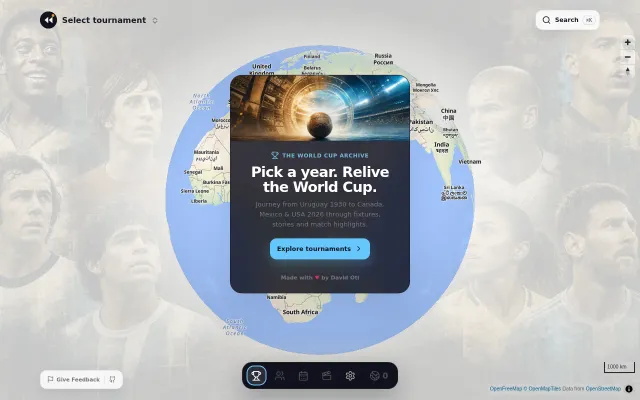
Globe visualization makes 23 tournaments feel explorable, not just listed.
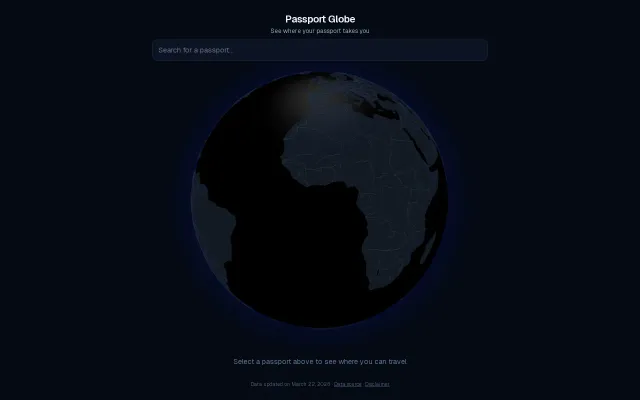
Pretty globe visualization, but visa data already exists on dozens of travel sites.
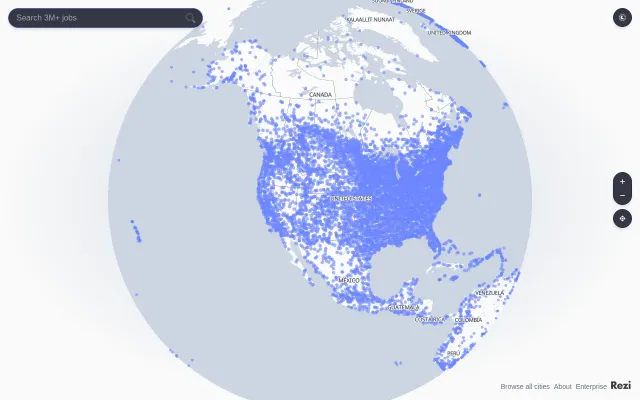
Globe visualization is novel, but LinkedIn and Indeed already solve job search better.
Pretty 3D routing globe, but real shipping uses bespoke routing and regulatory tooling.