Developer Tools●●Solid
kubectl-x to query multiple Kubernetes clusters at once
Valid JSON/YAML output across clusters; existing tools (kubectl-foreach, kubectl-allctx) don't.
Solve My ProblemNiche Gem
davidnortonjr
104mo ago
Pipes kubectl logs into an AI agent that actually knows your infrastructure dependency graph.
DevOps engineers, SREs, Backend developers
Datadog AI · Cortex · Rootly
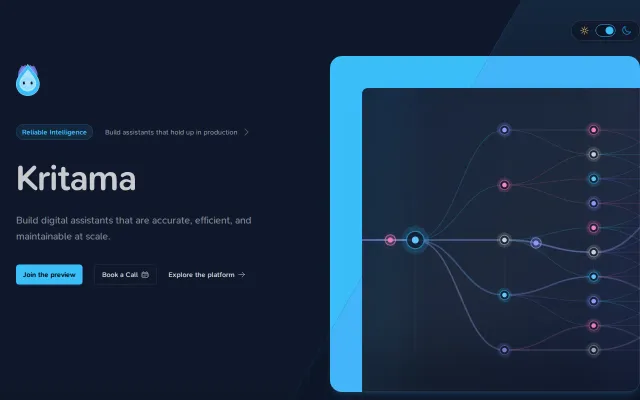
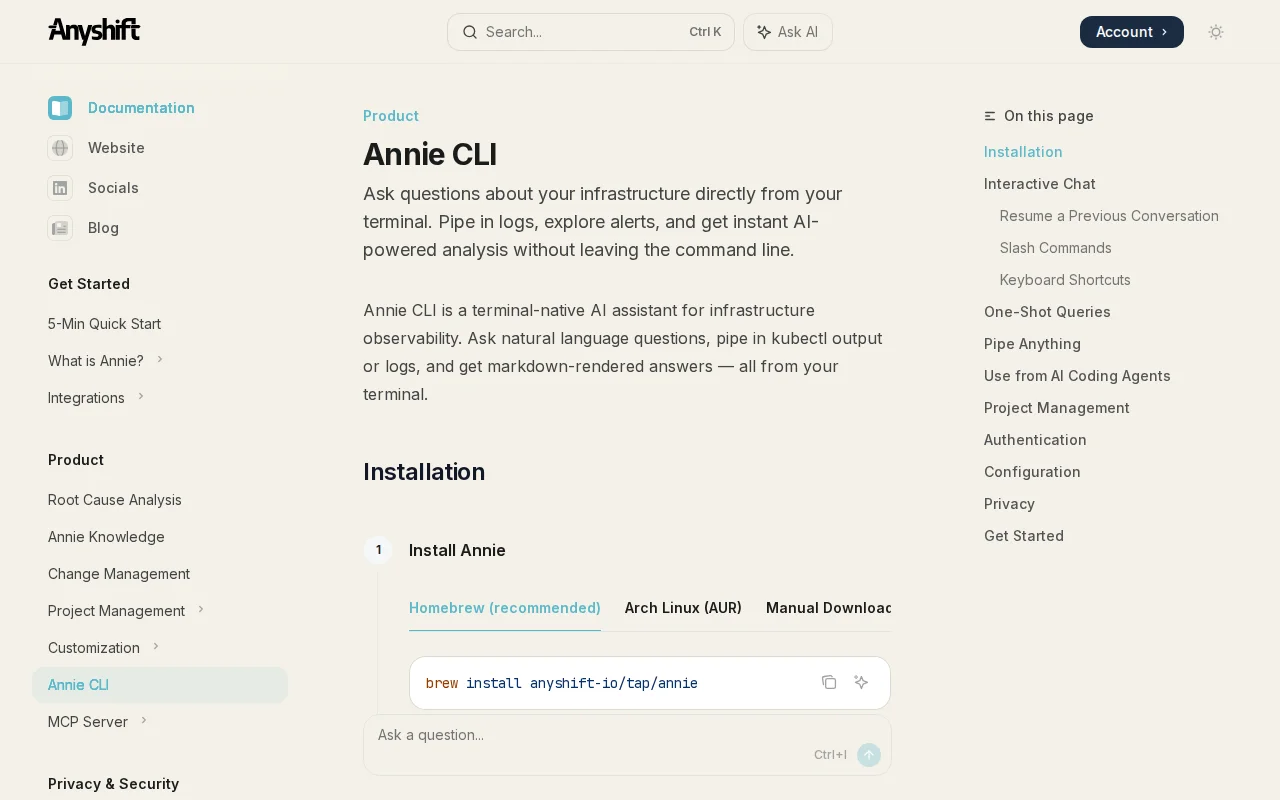
At Anyshift, we build the context layer agent in production. To do so we build a versioned graph of production infrastructure across AWS, Kubernetes, Datadog, GitHub, and more. Once connected, our CLI allows to debug incidents or perform deep analysis of what's happening or what happened in your prod.
For example:
kubectl logs -n rbl -l app=backend --tail=100 | anyshift ask "what's wrong?"
The scenario here: A Kubernetes backend is returning 502s every 5 seconds on /status. Logs show service discovery failures, but nothing obvious stands out. Instead of scanning manually you could pipe the logs into Anyshift.
It analyzes them against a pre-built dependency graph of your infrastructure: every resource, connection, and change over time.
Then it returns:
- failure chain (Redis cache miss → missing SERVICE_REGISTRY_URL → EC2 API resolution failure) - Impact scope (only external monitoring affected, no user traffic) - fix
Happy to answer questions!
Valid JSON/YAML output across clusters; existing tools (kubectl-foreach, kubectl-allctx) don't.
HCL-defined graph structure beats prompt chaining for complex agent logic.
Kubernetes root cause via dependency graphs, but kubectl debug and observability tools already solve this.
Another AI-powered deploy tool competing with Vercel, Railway, and Render.
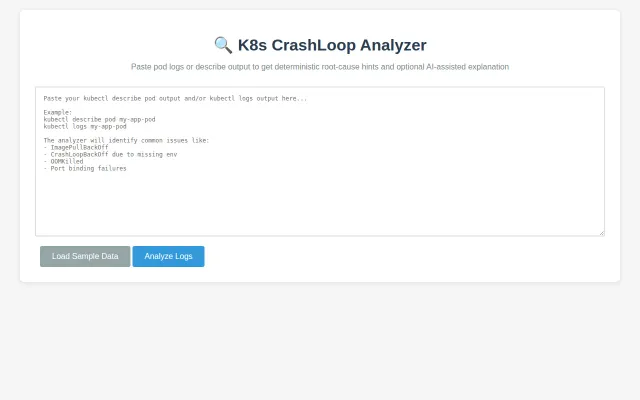
Deterministic log parsing for K8s crashes before falling back to AI explanations.
Read-only Kubernetes context engine with health, explain, trace, and graph commands for SREs.