Data●●Solid
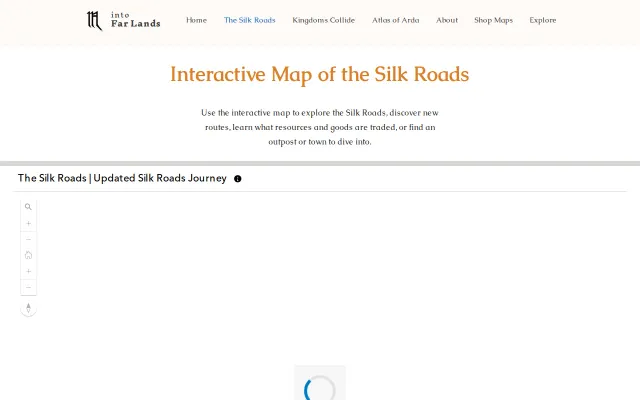
Bay Whale Strandings – interactive map of whale strandings in SF Bay
NOAA data visualized well, but Google Earth Engine already maps this.
Niche GemCozy
izgiuygur
101mo ago
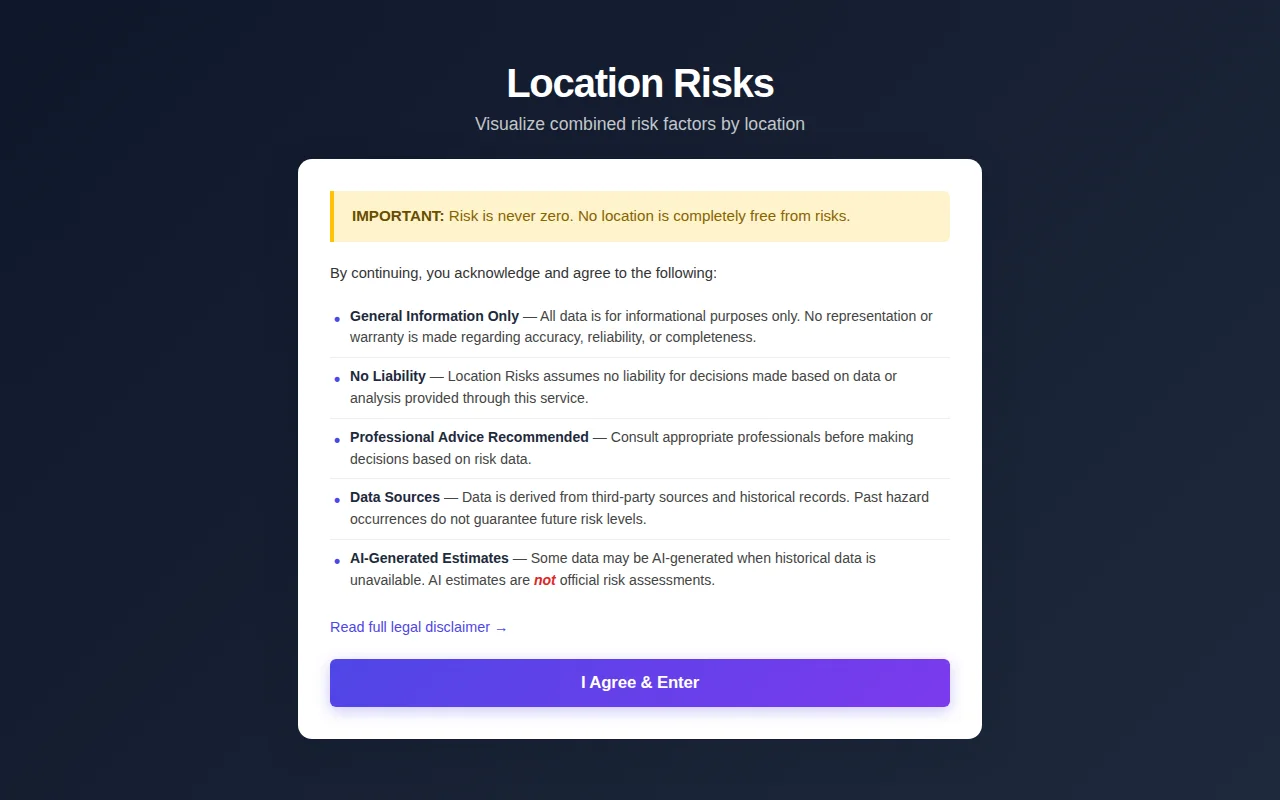
Policy preference toggles are clever, but NeighborhoodScout already does risk aggregation.
People relocating, real estate researchers
NeighborhoodScout · AreaVibes · SpotCrime
I wanted the UI to be simple. The interactive map is the main focus and the other details can be minimized if desired. Pick the risks you care about, select your policy preferences, and see the colors on the map. You can click a district for more details and add them to a comparison list.
The biggest challenge was finding data. It’s very hard to find data in many countries at a district level for niche risks. Because of this I decided to build an AI feature. It can be used to get AI risk estimates for any district and risk combination. The results of each AI estimate gets added to the database for all future users to see with an AI confidence level.
Is anything confusing to you when navigating the site? Are there any risks I’m missing?
NOAA data visualized well, but Google Earth Engine already maps this.
Eight years of research but it's content, not a tool — Atlas Obscura already does this.
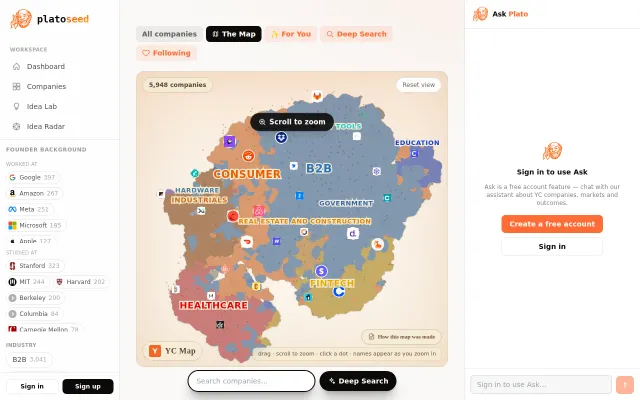
2D embedding visualization makes browsing 5000 YC companies genuinely explorable.
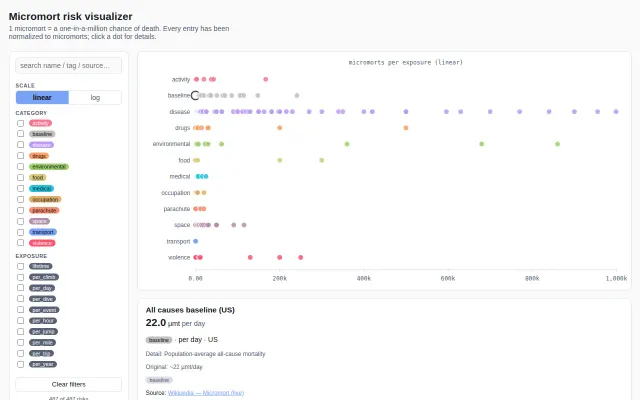
Sorting 487 risks by danger level is a genuine rabbit hole for the statistically anxious.
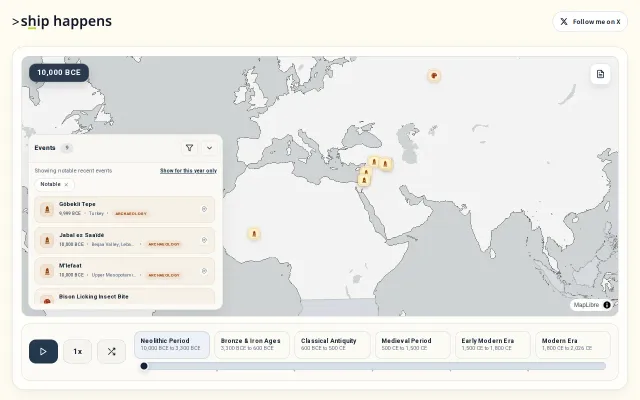
Yet another event aggregator with no automated data ingestion.
Interactive historical map aggregating Wikidata and OpenHistoricalMaps into one timeline.