Finance●Mid

Treasury – Ask your money anything
Another AI finance wrapper when Mint and Copilot already exist.
Slick
junead01
322mo ago
Meetrics is a personal metrics tracker built for curious people who want to understand themselves through data. Log anything that matters to you — weight, mood, sleep, grades, habits, workouts, or any custom metric — and explore how it changes over time.
Time-lag correlation finds delayed health patterns generic trackers miss.
Patients tracking chronic conditions, quantified self enthusiasts
Apple Health · Gyroscope · Exist.io
The Correlate feature is what made it click for me. I found that my chemo side-effects peaked at an 8-day lag — not when the doctors said they would. I showed the chart to my oncologist and it changed the conversation from "I think the side-effects come later than you warned" to "here's the data."
Recently my CT scan showed all tumors shrinking for the first time. Digging into the data, the clearest signal is a sharp increase in daily steps over the past month — partly better weather, partly a new puppy who needed walking. Steps are a known predictor of cancer survival, and the correlation-with-lag tool made it easy to see the timing line up with my scan window.
There's also a premium AI Analyst tab (powered by Claude) that answers natural-language questions about your data and generates daily insight cards. It's how I pay the bills while I'm not working and fighting cancer — the core tracking and analytics are free.
The app is general-purpose. I use it for cancer, but it works for anything — habits, grades, mood, workouts, macro data. I wrote a separate post using it to find the 12-18 month lag between Fed rate changes and unemployment.
Free on iOS: https://apps.apple.com/us/app/meetrics/id6760925743 Full write-up with screenshots: https://github.com/sergeybok/meetrics-support/blob/main/BLOG... Would love feedback from the QS/data crowd here.
Another AI finance wrapper when Mint and Copilot already exist.
Fills a real gap: guideline-to-action clarity, but AI role is minimal—rule-matching is table stakes.
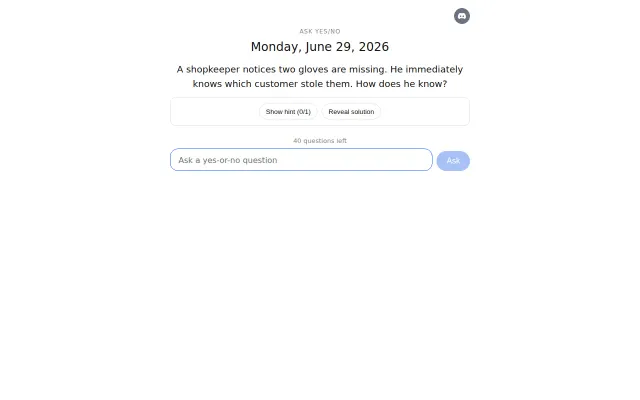
Daily riddle format works but lateral thinking puzzles already exist everywhere.
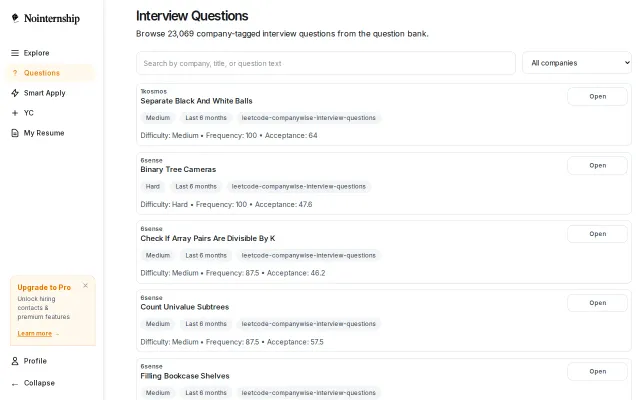
Company-tagged question bank when LeetCode already offers this feature.
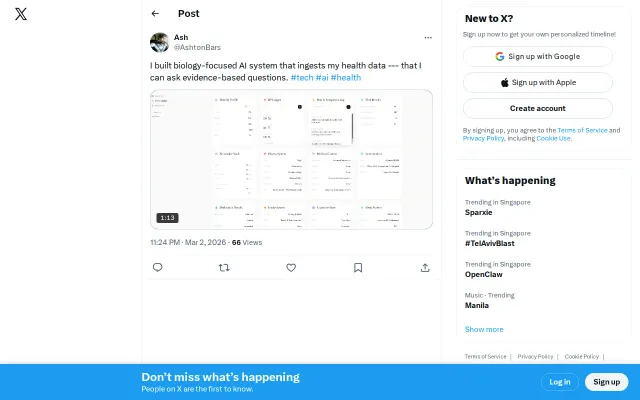
Local health AI, but no demo, no code, no proof it works better than ChatGPT.
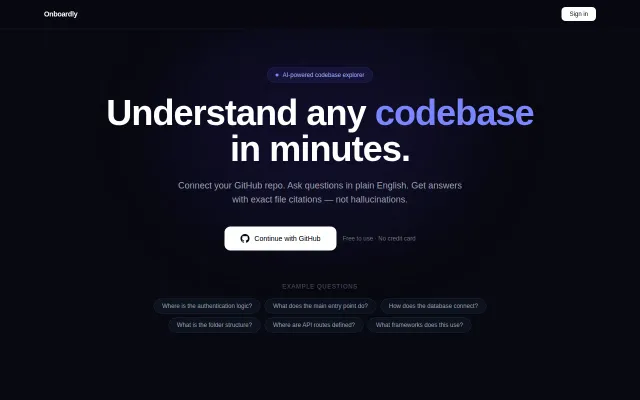
Yet another codebase Q&A tool when Cursor and Continue already do this.