Developer Tools●Mid
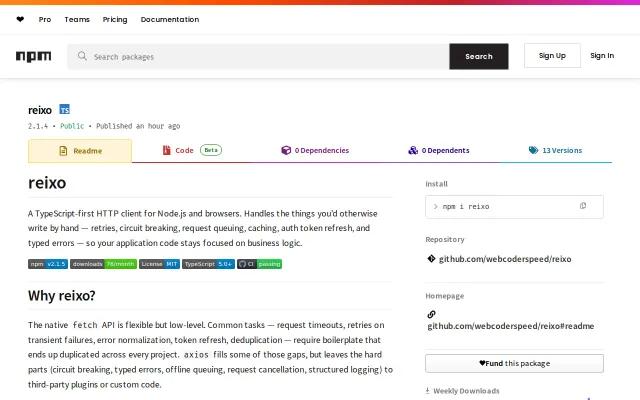
Reixo – HTTP client with no-throw Result<T,E> and zero-dep OTel
Yet another HTTP client competing with axios, ky, and got in a saturated market.
Solve My Problem
webcoderspeed
204mo ago
A lightweight, local OpenTelemetry trace viewer
Zero-config OTLP listener beats Jaeger for local trace debugging sessions.
Backend developers debugging distributed systems locally
Jaeger UI · Tempo · Honeycomb
During my recent projects with OpenTelemetry, I was looking for a truly practical tool for local development.
I found several existing solutions —some very powerful— but for my day-to-day local use, they were often too heavy, not simple enough to install, or not quick enough to get started with.
So I decided to build my own dedicated tool: otel-gui.
This is not a complete observability suite nor a telemetry backend designed for large-scale production or long-term retention. It's a tool designed for developers who want to debug efficiently locally.
Yet another HTTP client competing with axios, ky, and got in a saturated market.
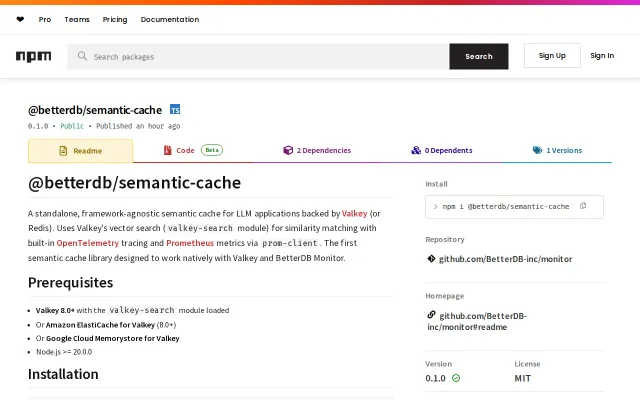
First semantic cache handling Valkey Search 1.2 divergences without silent breaks.
Wire-protocol parsing means zero code changes to existing OpenTelemetry setups.
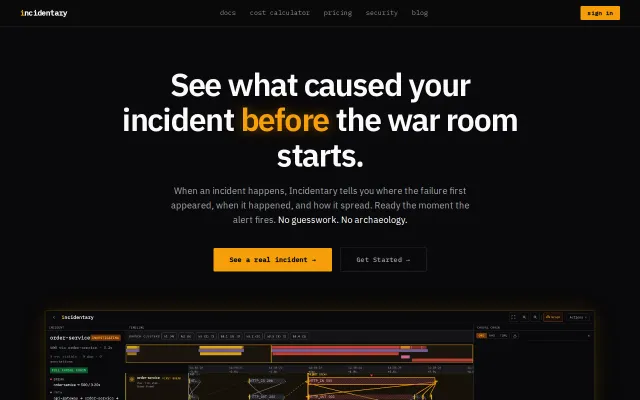
Filter OTLP at the gateway before ingestion—cuts observability costs before they hit Datadog.
Fills the gap between flat trace generators and 15-container Docker Compose demos.
Mitmproxy integration shows raw HTTP when LangSmith only shows parsed traces.