Productivity●Mid
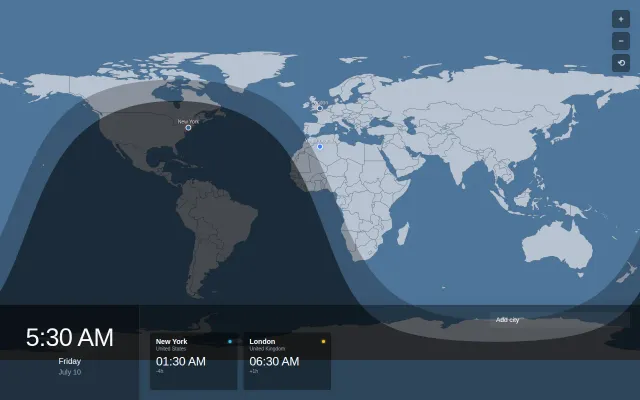
World Clock with Twilight/Night Overlayed on Map
Nice twilight visualization, but timeanddate.com already does this better.
Eye Candy
plun9
1019d ago
Renaissance parchment aesthetic makes global data exploration feel deliberate.
History enthusiasts and data visualization fans
Google Earth · Mapbox · Globo
I built a 3D interactive world map: https://world.gjlmotea.com/
Lately, time seems to be flying by. I've been building a lot of quirky, experimental projects, but honestly, my mood has been quite restless and low. There are just too many options and new technologies emerging every day—choice paralysis sets in before I can even figure out what I truly want to build.
But this project is different. It’s more grounded, human, and carries a sense of warmth. I wanted to create an immersive experience with a Renaissance, antique parchment aesthetic.
Features:
Explore: Browse different countries and click on nations or architecture for detailed information.
Data Layers: Toggle between various global map modes including Architecture, Culture, Academia, Commerce, and Military.
Themes: Multiple visual themes to switch between.
3D Architecture: Scale the models of buildings (like Taipei 101) to your liking.
Global Enterprises: It maps the top 100 global commercial empires across Finance, Industry, Food, and Tech—from TSMC, MediaTek, and Foxconn to everyday chains like McDonald's.
The Macro Perspective: As you zoom out from the map, the perspective shifts:
First, you can observe constellations and celestial bodies.
Keep zooming, and you'll see the 8 planets of our Solar System.
Zoom out even further, and you are met with a beautiful view of the Milky Way.
Nice twilight visualization, but timeanddate.com already does this better.
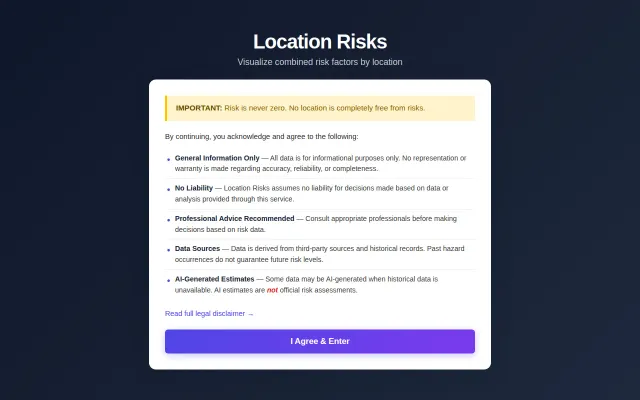
Policy preference toggles are clever, but NeighborhoodScout already does risk aggregation.
Real-time world map of your connections makes invisible network activity visible.
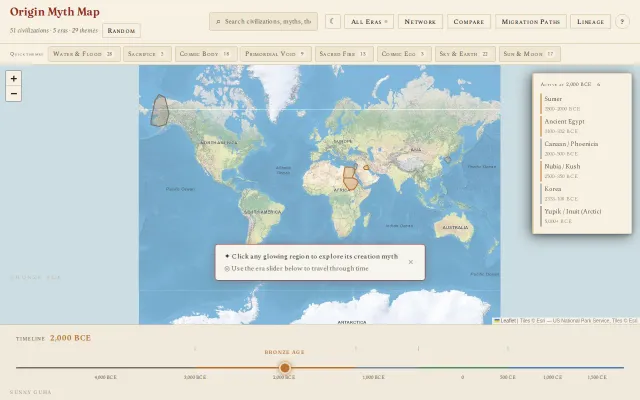
Timeline slider lets you traverse 5,000 years of creation myths across 51 civilizations.
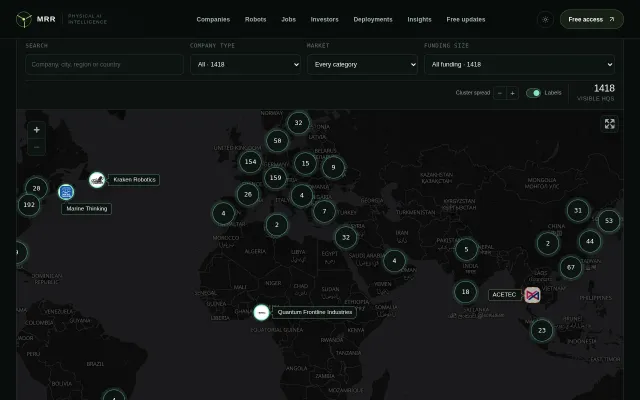
Curated dataset of 1,418 robotics HQs beats generic Crunchbase filters for this specific vertical.
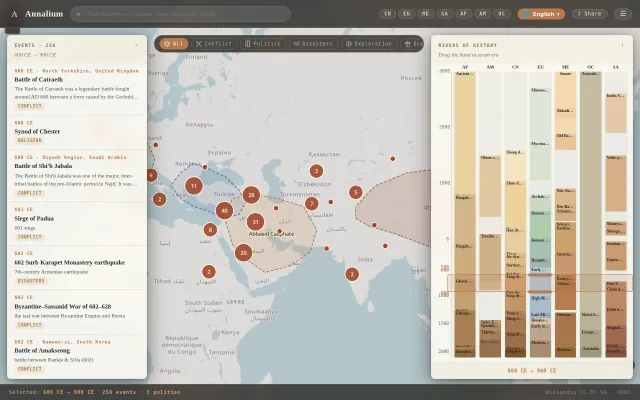
Dual map-timeline view makes historical patterns visible in ways single-axis tools can't.