Developer Tools●●Solid
SQL Crack – Local-first SQL visualizer with column lineage
Column lineage tracing through joins and aggregations—execution flow visualization done well.
Eye CandySolve My Problem
buva
113mo ago
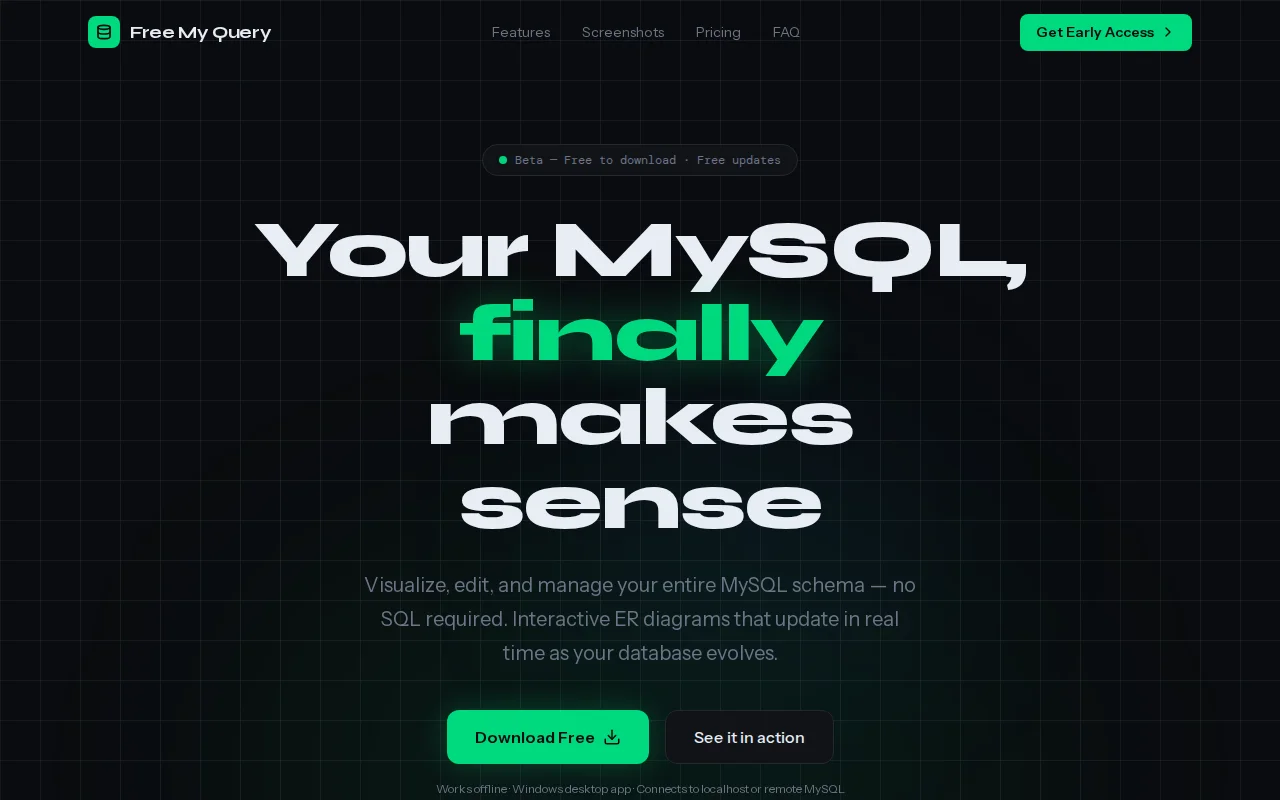
Live ER diagrams that update in real-time beat Workbench's static exports.
Backend developers and database administrators
MySQL Workbench · DBeaver · TablePlus
Column lineage tracing through joins and aggregations—execution flow visualization done well.
The side-by-side visual builder and live SQL editor is the real payoff — drag tables onto a canvas, draw joins, and watch the SQL and results update so JOINs actually click. It's not a novel database, but shipping an in-browser SQL sandbox with a downloadable client, sample e‑commerce dataset, and no-signup access makes this a very effective, demo-friendly way to learn tricky SQL concepts.
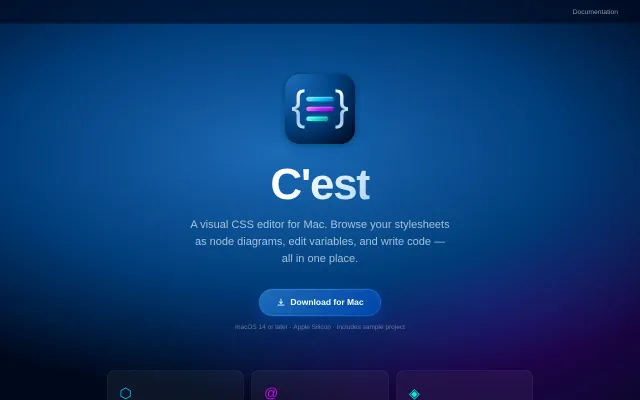
Visual node diagrams make CSS cascade relationships explicitly clear to developers.
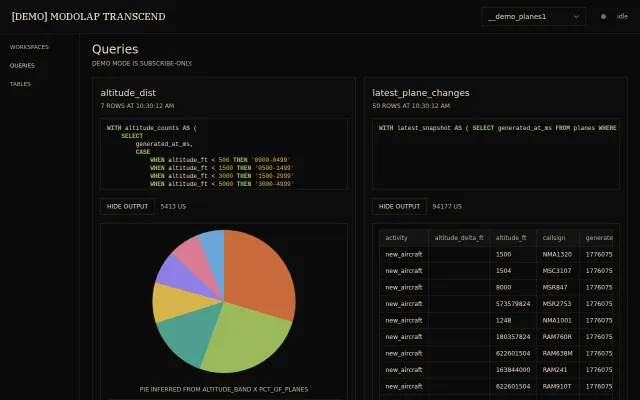
Streaming SQL engine demo locked behind subscribe wall in crowded category.
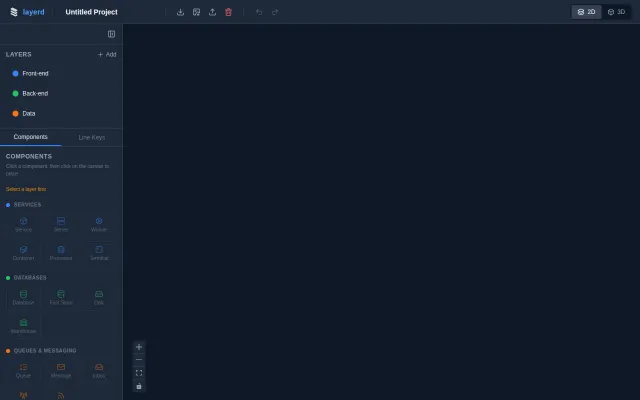
The layer-first canvas and a clear components palette (Services, Databases, Queues, Line Keys) make expressing front-end/back-end/data separation quick and visual. The 2D↔3D toggle is a neat flourish for showing stack depth and ownership, but without visible integrations (Terraform/Cloud import, export/collaboration, or smart layout) it reads as a nicer-looking competitor to existing diagram tools rather than a workflow disruptor.
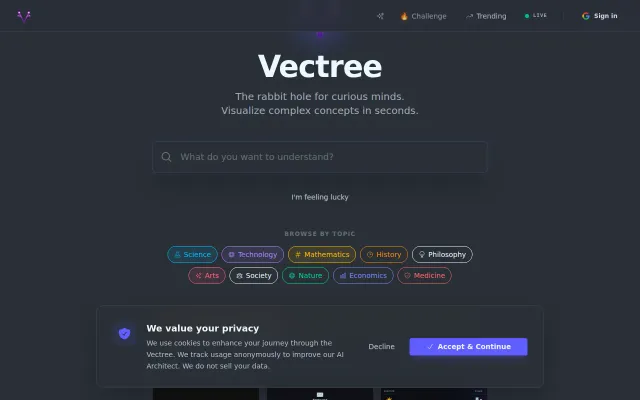
AI-generated SVG maps let you click through concepts like a visual Wikipedia.