Other●Mid
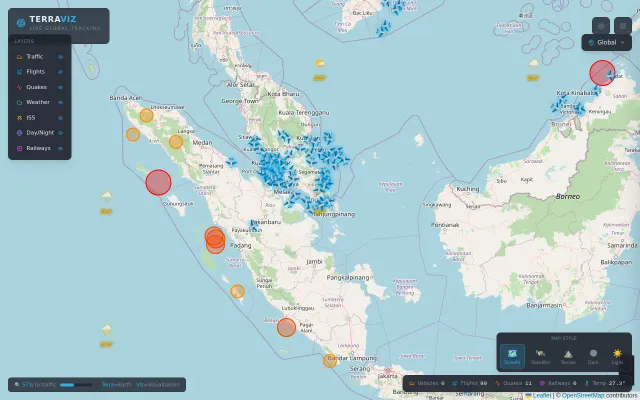
TerraViz – Real-time flights, earthquakes, ISS on one map
Polished geospatial dashboard, but FlightRadar24, Windy, and USGS already do each layer better.
Eye CandyRabbit Hole
cvaambikapur
113mo ago
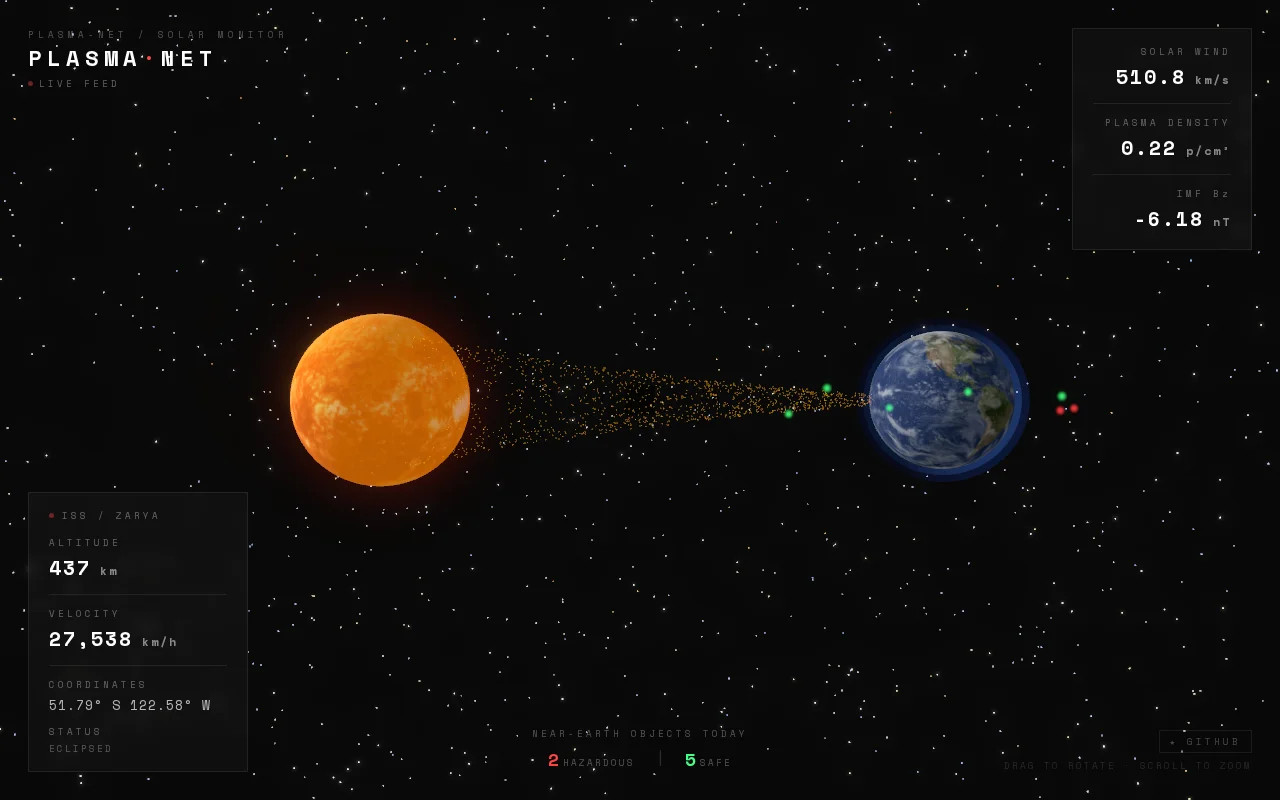
Live solar wind visualization layered over ISS tracking—neat combo nobody asked for.
Space enthusiasts, data visualization fans, educators
N2YO.com · Space-Track.org · SolarWind.io
Polished geospatial dashboard, but FlightRadar24, Windy, and USGS already do each layer better.
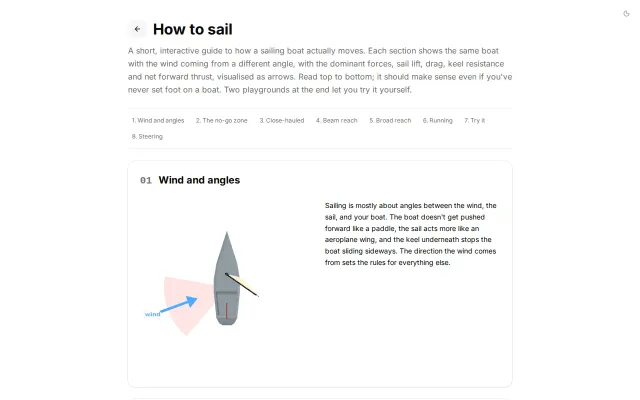
Vector arrows dynamically show why you can't sail straight into the wind.
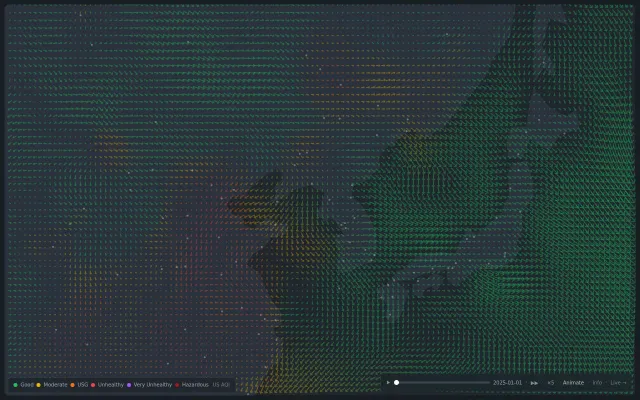
Animated wind vectors combined with selectable pollutant layers (PM2.5, PM10, NO2, etc.), playback speed and a date slider make it immediately useful for spotting transport patterns and hotspots. Feels like a focused, browser-hosted nullschool for pollution — visually effective but somewhat derivative, and the page doesn’t make the data sources or station-level provenance obvious.
Guided tour builds orbital intuition step by step with real physics.
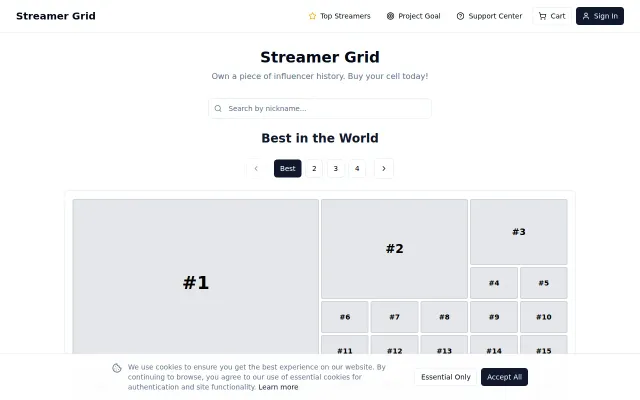
Yet another 'own a piece of X' scheme with no technical differentiation.
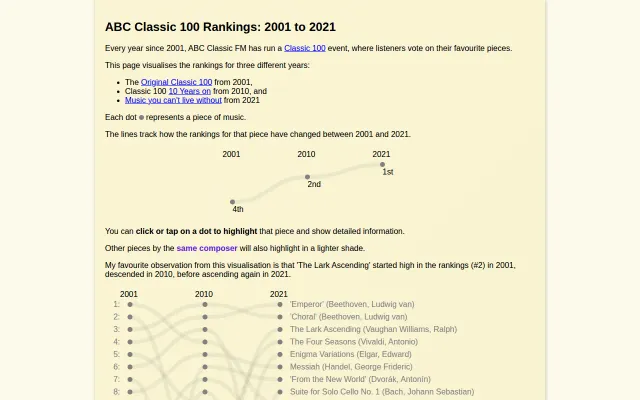
Charming one-off visualization, but not a reusable tool for your own data.