Developer Tools●●Solid
PrismCat – Local transparent proxy and debugging console for LLM APIs
Subdomain routing means zero /etc/hosts edits—just change base_url and capture everything.
Big BrainSolve My Problem
etgpao
2223d ago
Agent layer for observability
ML log clustering that sits beside Datadog and Loki without replacing your stack.
Backend developers, DevOps engineers, SREs
Datadog · New Relic · Grafana Loki
The problem that I run into is when an alert fires, I have to manually check the Grafana dashboards and write LogQL queries, which is pretty much like greping. But production usually breaks due to a schema mismatch, or a DB connection issue or a log line that I haven't seen before that's buried under millions of log lines. Much worse, the alert never fires, and I don't know when to grep
Rocketgraph fixes that. It turns your logs into patterns by fingerprinting them, then uses ML to anomaly score them by features like frequency, text similarity and other vectors. So, usually this condenses a million logs into 200-300 patterns with anomaly scores and feature vectors that your LLM can easily analyse without sending the entire firehose. This runs at specific points in time, so it's like an online anomaly detection based on logs.
Some companies do anomaly detection on metrics, but this is done for logs.
Other approaches in this space bolt an AI on top of existing Grafana dashboards, but it's the same thing as manually greping with extra steps.
Please check out the example setups to host it locally and run it on your log files. Let me know what you guys think!
Subdomain routing means zero /etc/hosts edits—just change base_url and capture everything.
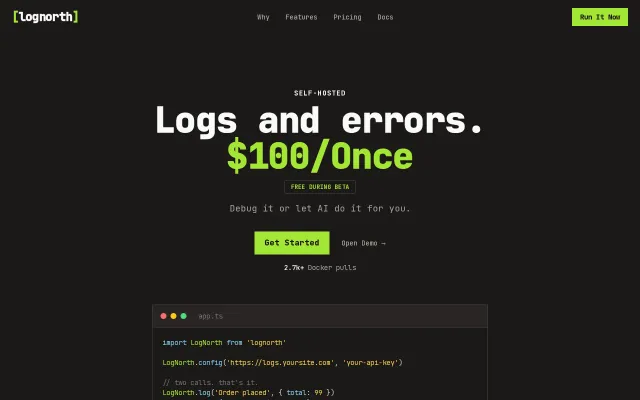
$100 one-time pricing undercuts Sentry subscriptions for self-hosted teams.
Mitmproxy integration shows raw HTTP when LangSmith only shows parsed traces.
LLM logging dashboard, but Langsmith and Llamaindex already do this.
Single component replaces nginx + auth + monitoring for exposed Ollama instances.
Granular API key controls and token cost tracking beat basic llama.cpp wrappers.