Finance●●Solid

The Cascade Graph – An interactive map of AI and energy constraints
Maps physical economy constraints to investable tickers using sourced causal links.
Niche GemBig Brain
antisyzygy
26122d ago
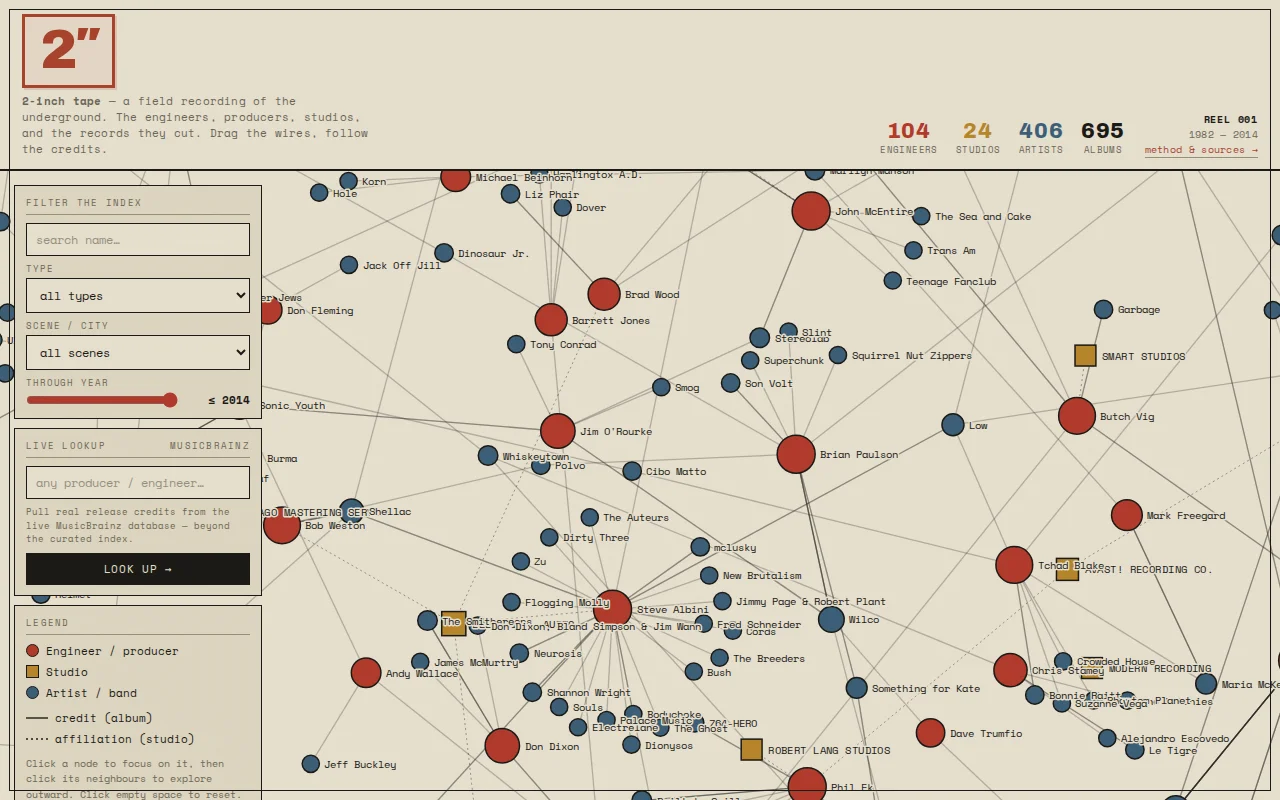
Follow production credits as a graph instead of scrolling text lists like Discogs.
Music nerds, audio engineers, producers, music historians
MusicBrainz · Discogs · AllMusic
Maps physical economy constraints to investable tickers using sourced causal links.
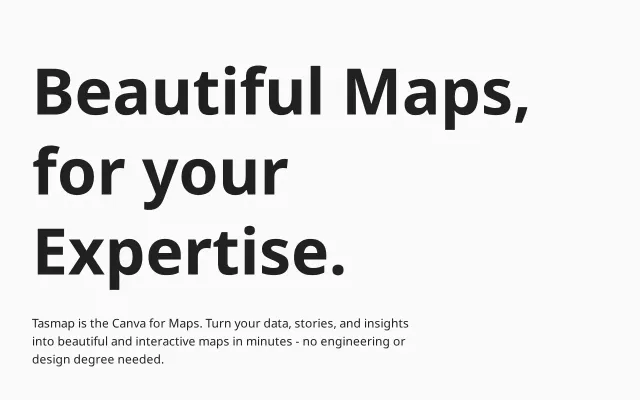
Canva for Maps when Mapbox, Google My Maps, and Carto already dominate this space.
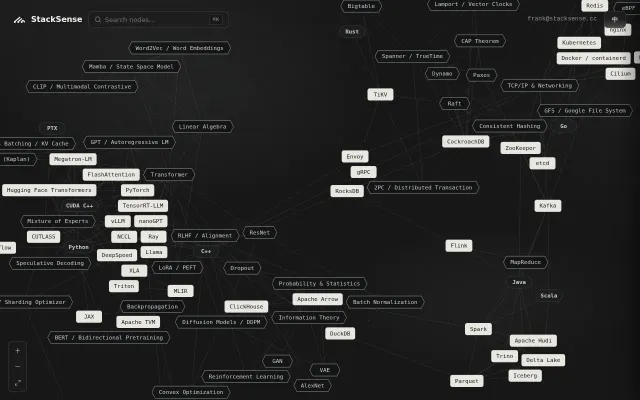
Massive interactive graph connecting LLMs to kernels, perfect for losing an afternoon.
Debugging missions beat Q&A — structured challenges instead of chatting with codebases.
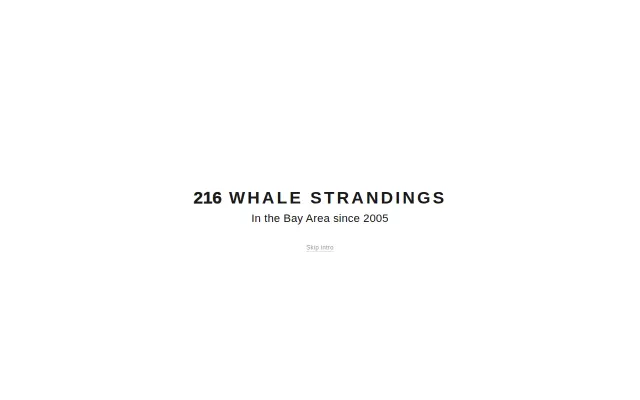
NOAA data visualized well, but Google Earth Engine already maps this.
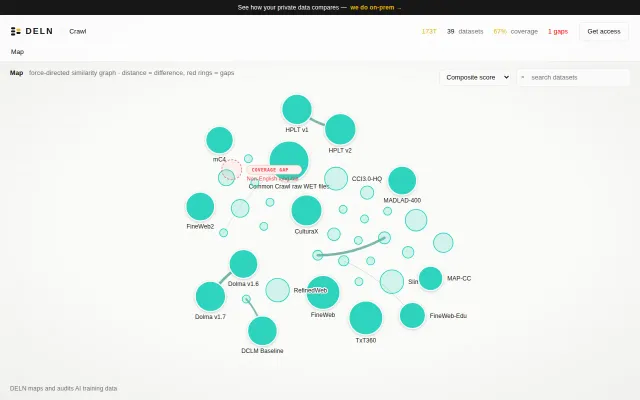
Force-directed dataset atlas with gap detection Hugging Face doesn't offer.