Developer Tools●●Solid
Grafana TUI – Browse Grafana dashboards in the terminal
Renders actual Grafana panels in your terminal when the web UI is just a tab switch away.
Niche GemCozy
lmazgon
2483mo ago
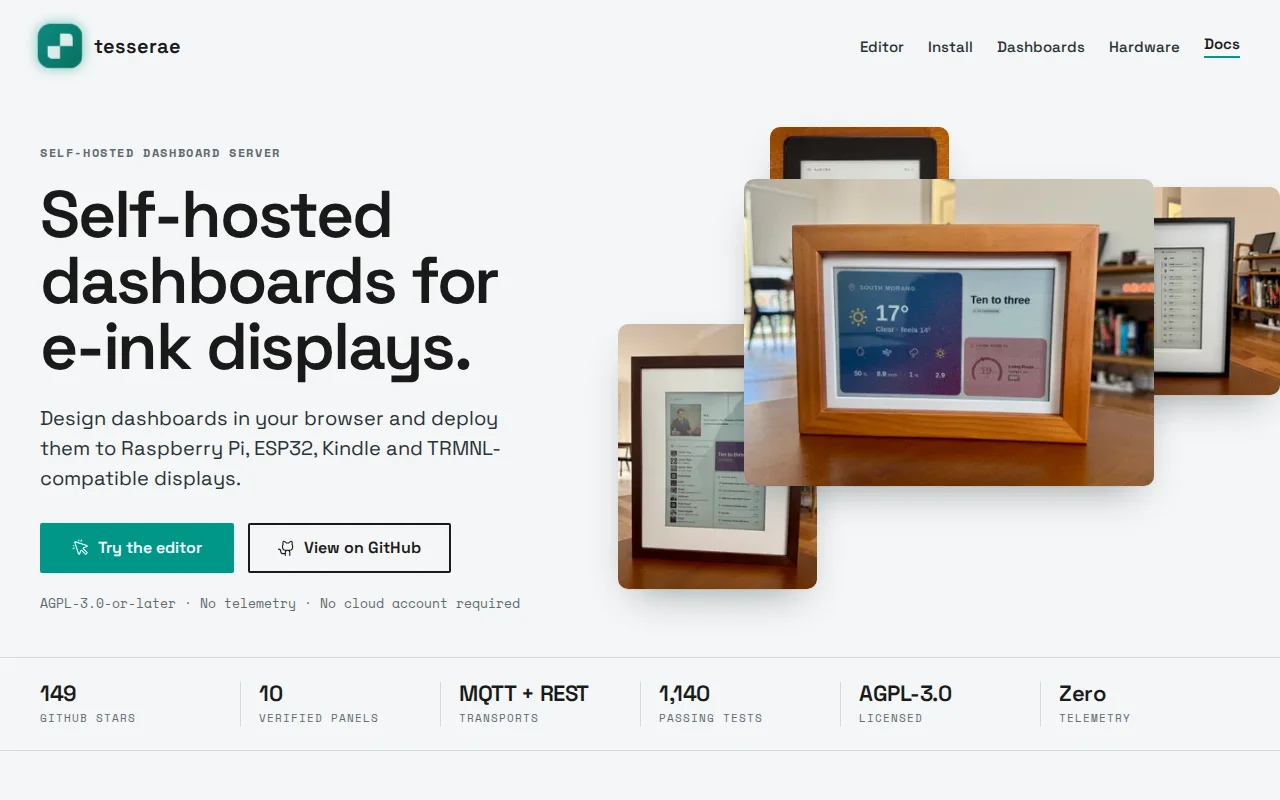
Playwright-captured HTML dashboards rendered to e-paper across 10+ device types.
Hardware enthusiasts, home automation users, e-paper display owners
Home Assistant · Dashy · MagicMirror²
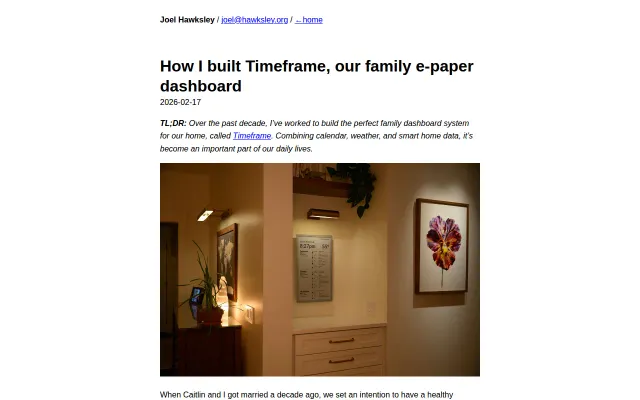
It turns out I had quite a collection of e-paper screens and wanted a simple way to drive them all. Something flexible, customizable, and that didn't require a cloud account. I couldn't find anything that fit my needs exactly, so I decided to roll my own solution.
What I ended up with: an HTML-based widget system that gets captured headlessly via Playwright, gets dithered and composed via panel-specific renderers, and then published to clients via REST or MQTT. All components (Widgets, renderers, and device kinds) are drop-a-folder plugins.
Hardware supported: Pimoroni Inky Impression panels via a client daemon, Waveshare panels via custom firmware, Seeed reTerminal and TRMNL devices via TRMNL firmware as well as jailbroken Kindles (or anything that has a TRMNL client)
The server publishes dashboards to all of these via a built-in rotation system.
The server and clients are AGPL-3.0-or-later. There are install scripts for windows/linux/OSX as well as full Home Assistant App support, Docker containers, or cloud-init.
This is my first post here. I hope people find this useful.
Renders actual Grafana panels in your terminal when the web UI is just a tab switch away.
MCP server integration brings AI workflows to ffmpeg parallel rendering.
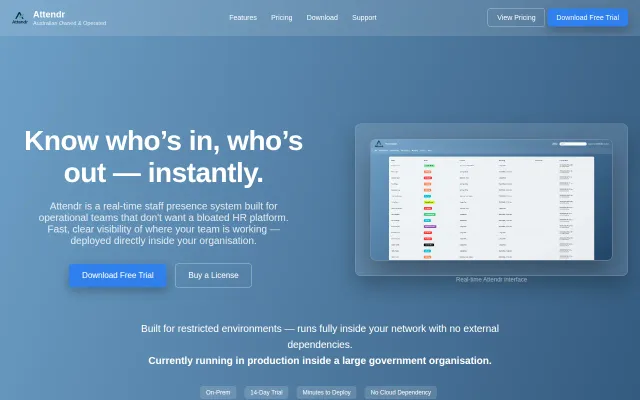
Hyper-focused on-prem dashboard already running in production inside government org.
Decade-long e-paper home project: unobtrusive ambient display for family calendar, weather, and IoT.
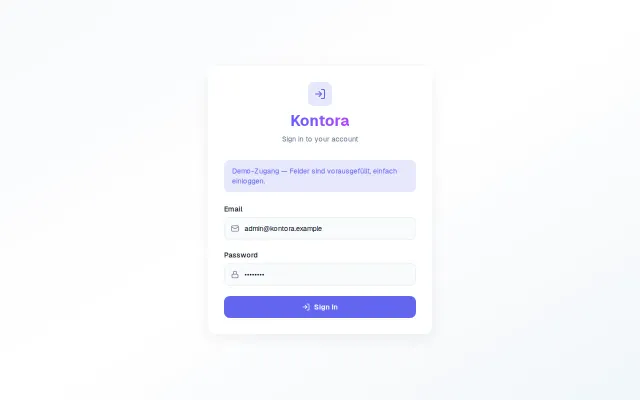
German tax calculations with self-hosting when QuickBooks ignores Germany.
Yet another AI observability wrapper in a space Datadog already dominates.