Developer Tools●●Solid
Rore GUI – An Open Qt Alternative in Rust (WGPU, Zero-VDOM)
WGPU rendering with sparse instancing and SDF shaders at 130MB RAM.
WizardryBig Brain
umid_davlatov
212mo ago
High-performance interactive system monitor for NVIDIA DGX systems — GPU, CPU, memory, disk, network in a beautiful TUI
Direct NVML access beats nvidia-smi subprocess calls for speed and reliability.
ML engineers and sysadmins managing NVIDIA DGX clusters
nvtop · btop · nvidia-smi
Any platform can work, If can't get the Nvidia GPU message, also can work. it will to get cpu, disk and network io information.
This Project will get detail infomation about the GPU.
And helps monitor the training process.
WGPU rendering with sparse instancing and SDF shaders at 130MB RAM.
Wire-protocol proxy means zero code changes to existing LLM clients.
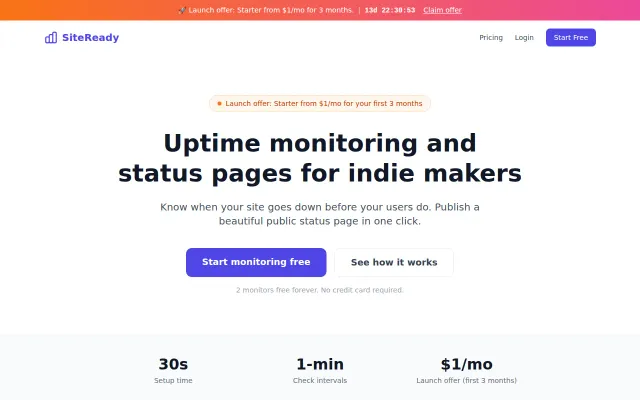
Clean, focused product: email alerts, response-time tracking, and instant public status pages with a forever-free 2-monitor tier make it easy to get started. It isn't reinventing monitoring, but the stripped-down pricing and one-click status publishing feel deliberately built for solo founders — missing advanced alerting (SMS/pager/on-call tooling) and broader integrations keeps it squarely aimed at small shops.
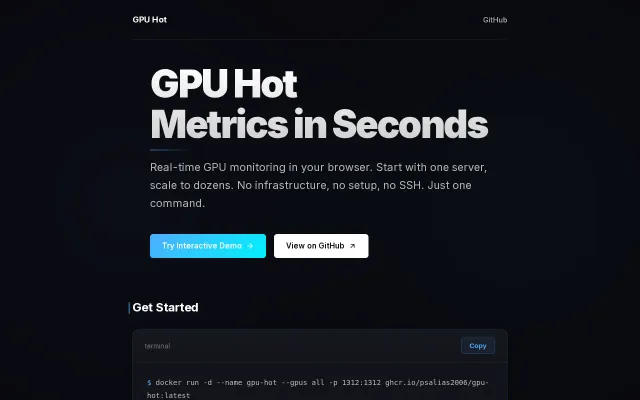
Shoots for zero-setup GPU visibility: one docker run spins up a service you open in the browser to see live NVIDIA metrics without Prometheus, SSH, or dashboards to configure. The UI and interactive demo show attention to UX and make it instantly useful for small clusters or single-node setups. It doesn’t reinvent observability — if you need long-term metrics, alerting, or enterprise integrations you’ll still reach for exporters + Grafana — but for lightweight, immediate GPU troubleshooting this is convenient and focused.
Extends Rust's ownership model across GPU boundary with tile-based partitioning for data-race-free kernels.
Directed hypergraphs in Rust with persistent snapshots and a generic query trait.