Data●●●Banger
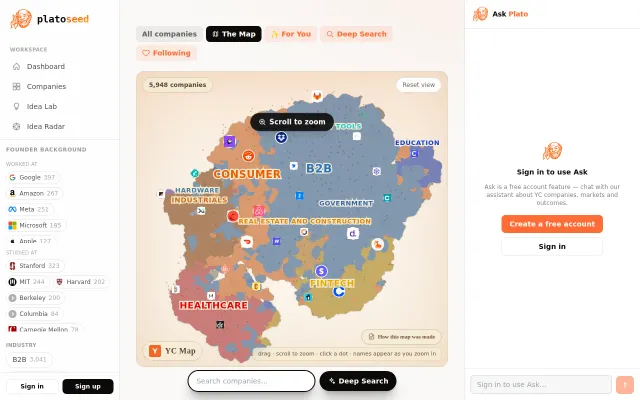
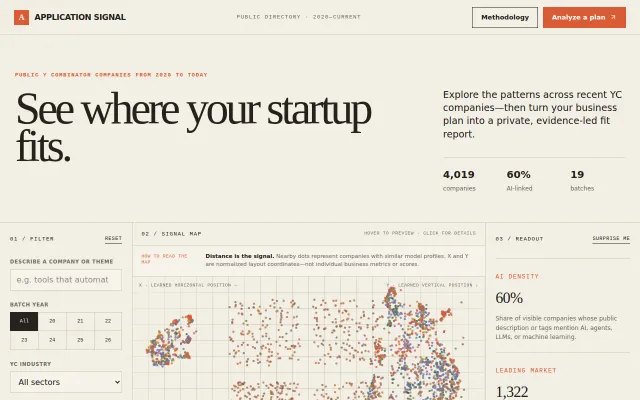
Map of 5000 YC Startups
2D embedding visualization makes browsing 5000 YC companies genuinely explorable.
Rabbit HoleBig BrainEye Candy
mdb19
101mo ago
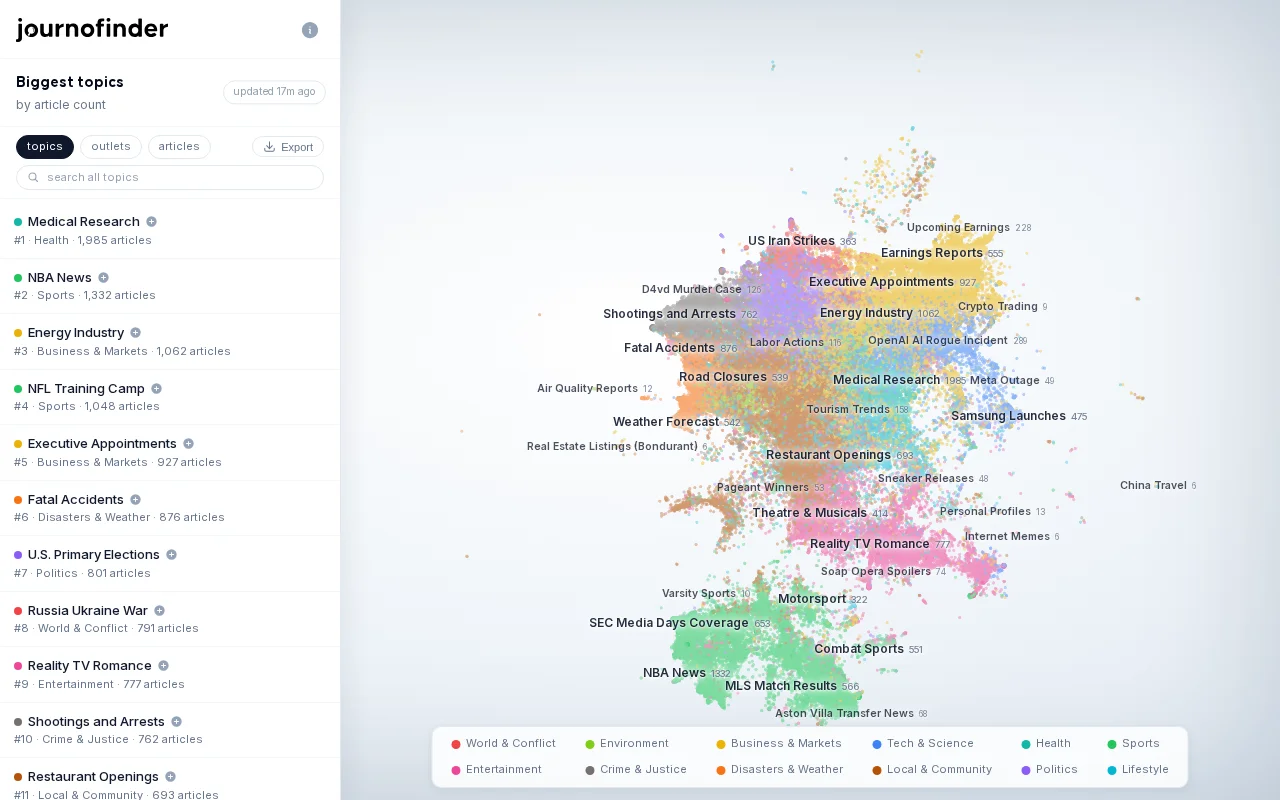
Recursive DBSCAN clustering turns 150k chaotic headlines into a navigable galaxy of news stories.
Data journalists, researchers, and news enthusiasts
Google News · Newsmap · GDELT Project
Each one is embedded with OpenAI's text-embedding-3-large, clustered into stories with hnswlib, laid out in 2D with UMAP so related topics sit near each other, grouped into topic regions with recursive DBSCAN, and labeled by an LLM. The map is rebuilt from scratch every hour.
I deliberately skipped progressive loading. The whole map loads upfront, ~18MB of data, and after that everything runs client-side with zero network requests: pan, zoom, search, cluster panels. deck.gl handles all 133k points fine, even on mobile.
Currently showing ~133,000 stories across 1,081 topics.
Happy to answer any questions.
2D embedding visualization makes browsing 5000 YC companies genuinely explorable.
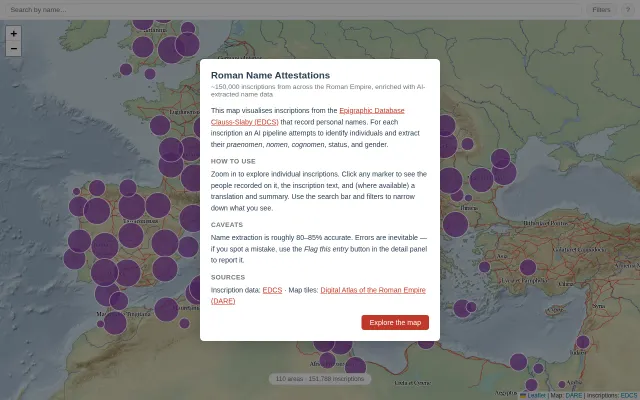
AI-extracted names from 150k Roman inscriptions mapped across the empire.
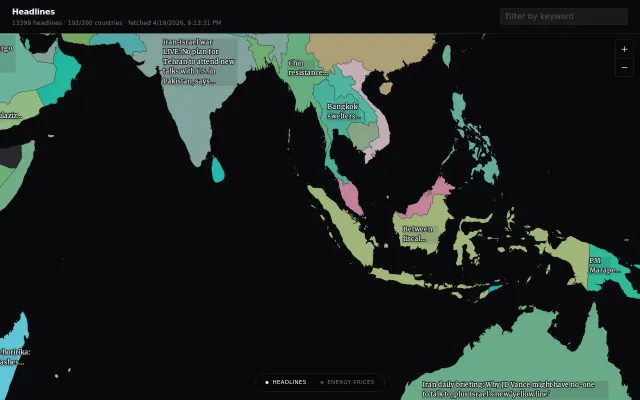
World map of 13k headlines lets you browse news by country instead of feed.
3D UMAP visualization finds conceptually similar constitutional provisions across 188 countries.
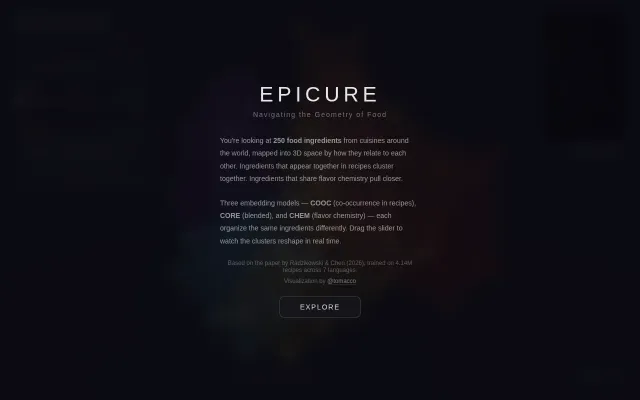
Real-time slider between three embedding models shows how ingredients cluster differently.
YC startup map with vector similarity clustering beats manual Crunchbase filtering.