Infrastructure●●●Banger
I replaced Grafana+Prometheus with a Go binary and SSH for my VPSs
Grafana+Prometheus replacement in one Go binary over SSH—zero HTTP, pure pragmatism.
Niche GemSolve My ProblemCozy
thobiasn
1103mo ago
Docker server monitoring without the stack. Metrics, logs, and alerts from your terminal. Single binary, zero exposed ports, SSH-only.
The trick here is practical: an agent exposes a Unix socket on the host and the client connects over SSH, so you get monitoring and alerts without opening ports. It bundles container log tailing (Docker log API), alert evaluation, and SQLite storage into a tiny Go binary — neat for small fleets, but the README warns it's still early-stage so expect rough edges.
Self-hosters, sysadmins and small-scale DevOps managing Docker on VPSs who want lightweight monitoring without a full Grafana/Prometheus/Loki stack
Grafana+Prometheus replacement in one Go binary over SSH—zero HTTP, pure pragmatism.
Self-hosted Uptime Robot alternative, but Uptime Robot, Betteruptime, Checkly, and Zabbix already solved this.
Replaces Prometheus+Grafana complexity with one container, zero config install.
Single Go binary beats Uptime Kuma for CLI-first teams who hate containers.
Lightweight monitoring for self-hosted LiveKit when LiveKit Cloud exists.
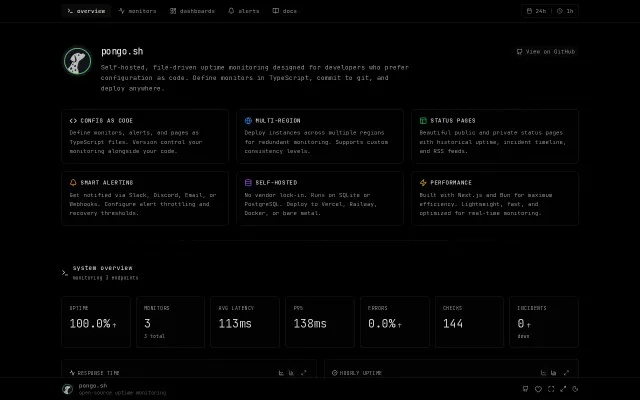
Config-as-code uptime monitoring beats dashboard vendor lock-in with git-driven workflows.