SaaS●●●Banger
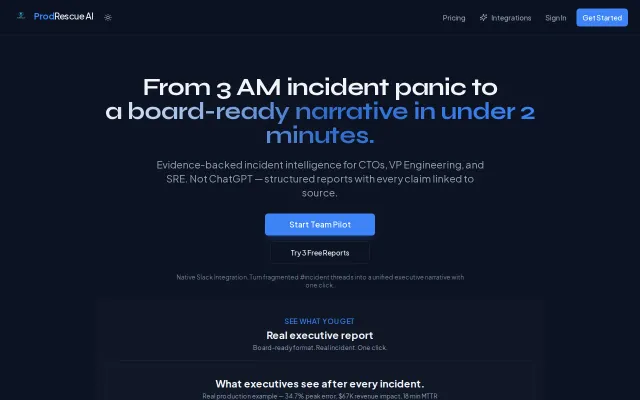
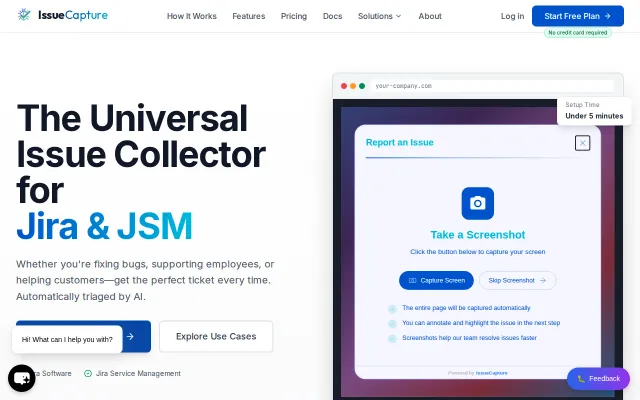
ProdRescue AI – Turn Slack war-rooms and raw logs into incident reports
Slack + logs → board-ready incident report with sourced evidence claims.
Solve My ProblemSlick
devrimozcay
413mo ago
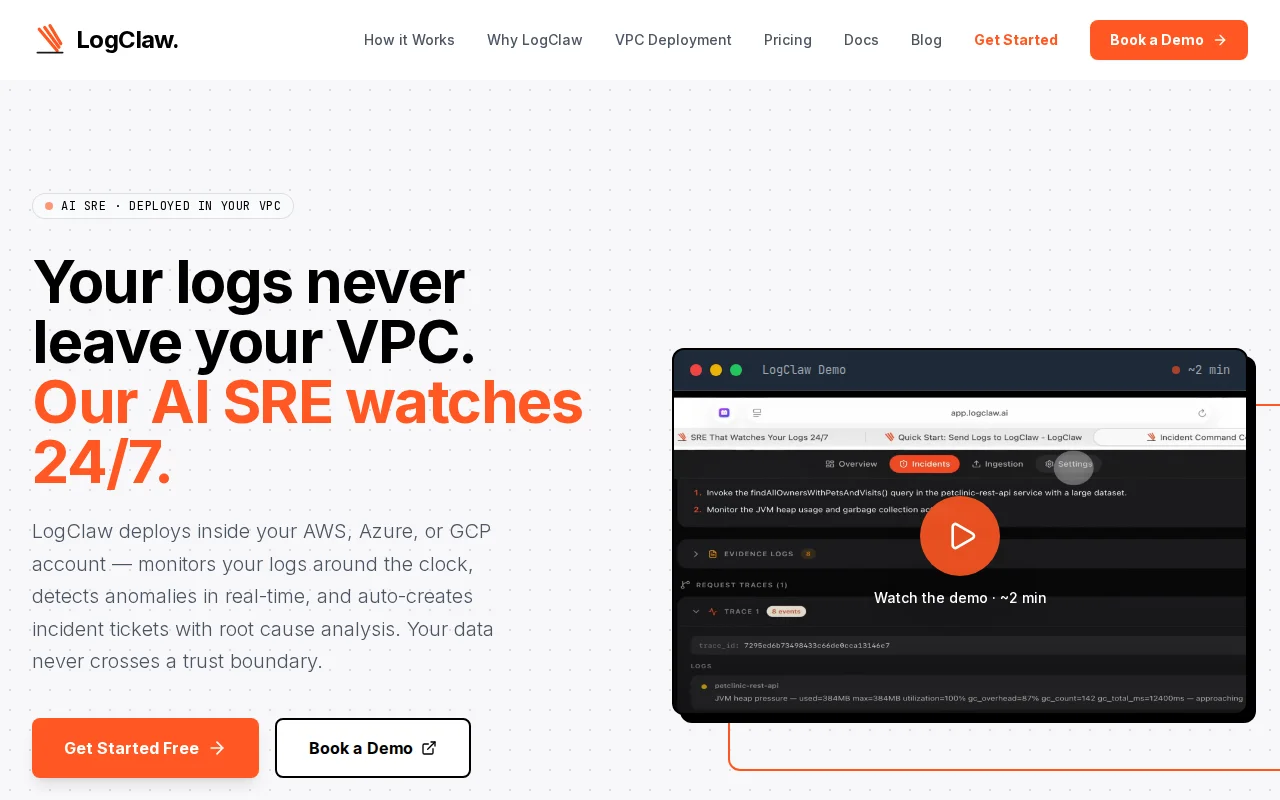
VPC-deployed AI SRE that beats Datadog on cost while keeping logs inside your trust boundary.
DevOps engineers and SREs managing production systems
Datadog · Splunk · PagerDuty
LogClaw is an open-source log intelligence platform that runs on Kubernetes. It ingests logs via OpenTelemetry and detects anomalies using signal-based composite scoring — not simple threshold alerting. The system extracts 8 failure-type signals (OOM, crashes, resource exhaustion, dependency failures, DB deadlocks, timeouts, connection errors, auth failures), combines them with statistical z-score analysis, blast radius, error velocity, and recurrence signals into a composite score. Critical failures (OOM, panics) trigger the immediate detection path in <100ms — before a time window even completes. The detection achieves 99.8% for critical failures while filtering noise (validation errors and 404s don't fire incidents).
Once an anomaly is confirmed, a 5-layer trace correlation engine groups logs by traceId, maps service dependencies, tracks error propagation cascades, and computes blast radius across affected services. Then the Ticketing Agent pulls the correlated timeline, sends it to an LLM for root cause analysis, and creates a deduplicated ticket on Jira, ServiceNow, PagerDuty, OpsGenie, Slack, or Zammad. The loop from log noise to a filed ticket is about 90 seconds.
Architecture: OTel Collector → Kafka (Strimzi, KRaft mode) → Bridge (Python, 4 concurrent threads: ETL, anomaly detection, OpenSearch indexing, trace correlation) → OpenSearch + Ticketing Agent. The AI layer supports OpenAI, Claude, or Ollama for fully air-gapped deployments. Everything deploys with a single Helm chart per tenant, namespace-isolated, no shared data plane.
To try it locally: https://docs.logclaw.ai/local-development
What it does NOT do yet: - Metrics and traces — this is logs-only right now. Metrics support is on the roadmap. - The anomaly detection is signal-based + statistical (composite scoring with z-score), not deep learning. It catches 99.8% of critical failures but won't detect subtle performance drift patterns yet. - The dashboard is functional but basic. We use OpenSearch Dashboards for the heavy lifting.
Licensed Apache 2.0. The managed cloud version is $0.30/GB ingested if you don't want to self-host.
Hi HN — I’m Robel. I built LogClaw after getting tired of waking up to alerts that only said “something is wrong” with no context. LogClaw is an open-source log intelligence platform for Kubernetes. It ingests logs via OpenTelemetry and detects operational failures using signal-based anomaly detection rather than simple thresholds. Instead of looking at a single metric, LogClaw extracts failure signals from logs (OOMs, crashes, dependency failures, DB deadlocks, timeouts, etc.) and combines them with statistical signals like error velocity, recurrence, z-score anomalies, and blast radius to compute a composite anomaly score. Critical failures bypass time windows and trigger detection in <100ms. Once an anomaly is confirmed, a correlation engine reconstructs the trace timeline across services, detects error propagation, and computes the blast radius. A ticketing agent then generates a root-cause summary and creates deduplicated incidents in Jira, ServiceNow, PagerDuty, OpsGenie, Slack, or Zammad. Architecture: OTel Collector → Kafka → Detection Engine → OpenSearch → Ticketing Agent Repo: https://github.com/logclaw/logclaw Would love feedback from people running large production systems.
Slack + logs → board-ready incident report with sourced evidence claims.
Merkle Mountain Range ledger proves AI agents can't retroactively fake logs—novel crypto primitive.
AI triage and console logs beat Jira's native Issue Collector for context.
Yet another session replay tool competing directly with FullStory and LogRocket.
Single-binary speed plus an indexed local DB, terminal heatmaps/graphs and one-command extractors make for a very practical tool when you need answers now. It also bundles unexpected extras — SIGMA rule checks, TF‑IDF and anomaly/AI commands — so it blurs the line between fast grep-replacements and lightweight local analytics. The space is crowded, but the combination of indexing + built-in analytics in a cross-platform Go CLI is a neat, well-realized approach.
SHA-256 hash chains for AI audit trails—solves EU AI Act compliance elegantly.