Infrastructure●●Solid
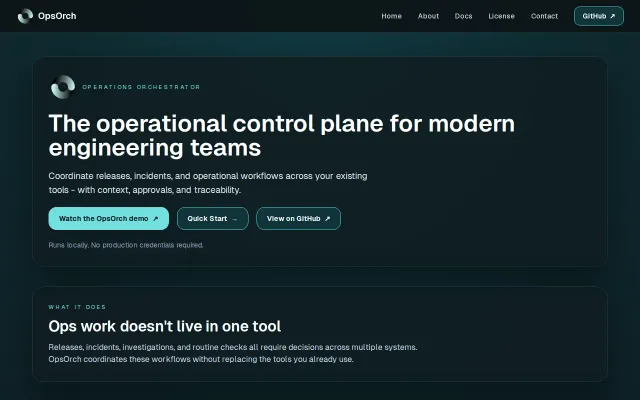
OpsOrch – a unified API for incidents, logs, metrics, and runbooks
Unified ops schema is useful but Backstage already does this with more adoption.
Solve My ProblemSlick
yusufaytas
304mo ago
A web page performance tester with support for Prometheus, InfluxDB, Graphite, and Datadog
Open-source synthetic monitoring with multi-backend support and API workflow chaining.
SREs, DevOps engineers, Backend developers
Checkly · Grafana Blackbox Exporter · Pingdom
It gives you insight into timings like TTFB, DNS resolution, TLS negotiation, server processing, and content delivery. It also supports chromedp for automated gathering of browser metrics like page render timings.
It's very easy to configure and includes a Helm chart for deployment into K8S.
Unified ops schema is useful but Backstage already does this with more adoption.
Cross-references query logs, rules, and Grafana to find unused metrics.
Prometheus metrics rendered as cartoon faces—novelty visualization that's surprisingly readable for quick health scans.
Natural language queries cut Kafka metric troubleshooting from dashboard hunting to conversational.
Prometheus metrics for Shelly plugs when Home Assistant is too heavy.
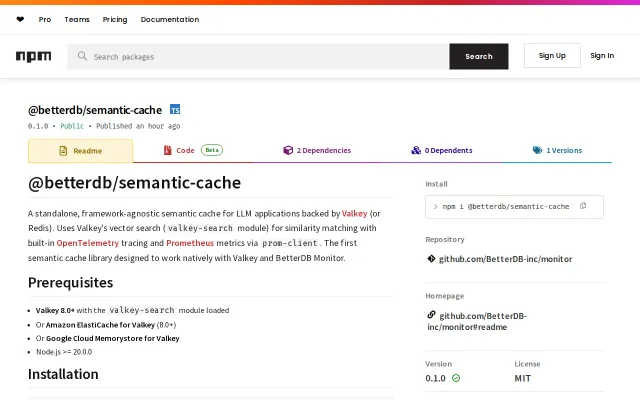
First semantic cache handling Valkey Search 1.2 divergences without silent breaks.