Education●●●Banger
Interactive first-principles climate physics simulation with explainer
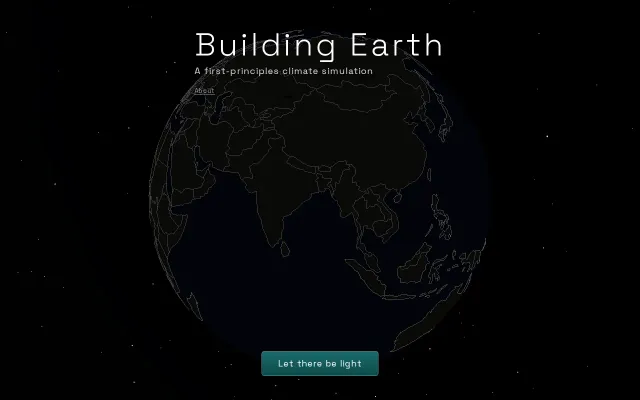
Layer-by-layer physics simulation teaches climate science better than any textbook video.
Rabbit HoleBig BrainEye Candy
crackalamoo
2021d ago
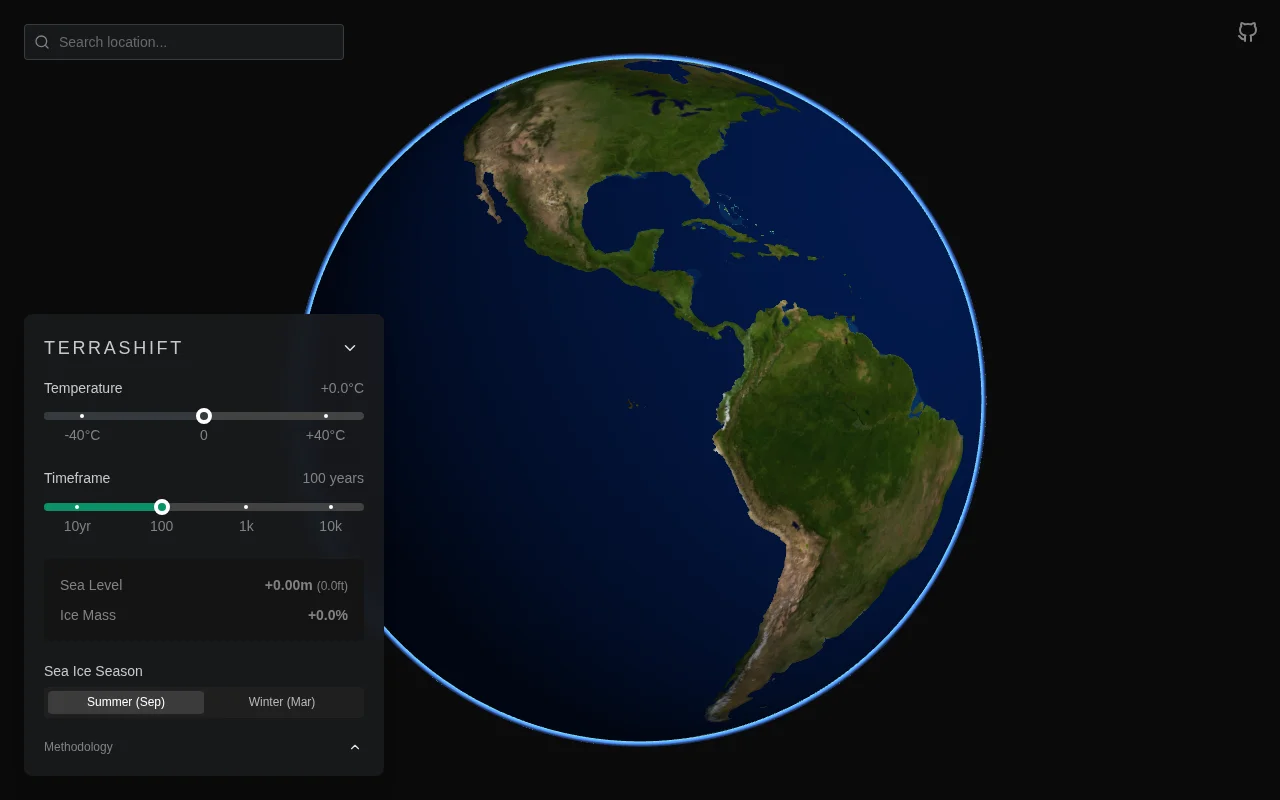
Temperature slider drives real satellite data visualization better than static climate maps.
Climate enthusiasts, educators, weather nerds
Climate Central · NASA Climate Visualizer · Windy.com
Click anywhere on the globe to see projected snowfall changes for that location.
---
I'm an amateur weather nerd who spends a lot of time on caltopo.com and windy.com tracking snow/ice conditions. I wanted to build something fun to imagine where I could go ski during an ice age.
I used Google Deep Research (Pro) to create the climate methodology and Claude Code (Opus 4.6 - High) to create the site.
The code: https://github.com/travistruett/terrashift
The models aren't proper climate simulations, they're simplified approximations tuned for "does this look right?" but more nuanced than I expected them to be. The full methodology is documented here if anyone wants to poke holes in it.
https://github.com/travistruett/terrashift/blob/main/docs/al...
Layer-by-layer physics simulation teaches climate science better than any textbook video.
Pretty globe, but Google Maps 3D, Mapbox, and Globe.gl demos already exist.
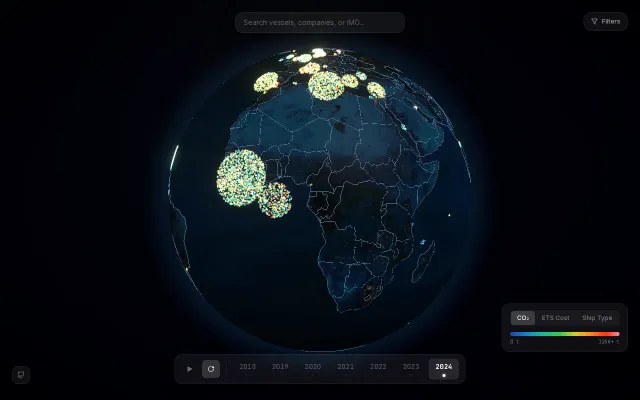
Gorgeous 3D emissions viz, but data exploration tools like THETIS already exist.
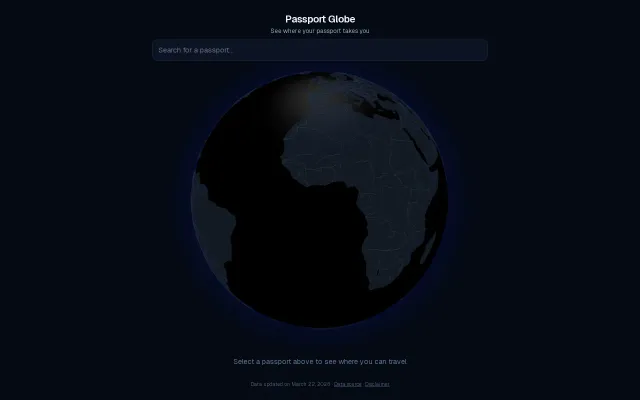
Pretty globe visualization, but visa data already exists on dozens of travel sites.
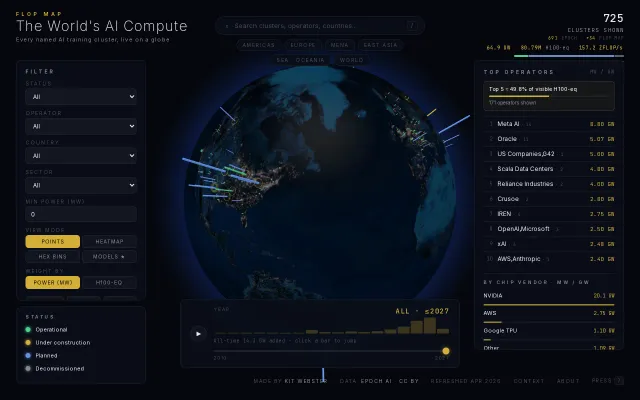
Stunning 3D globe tracking 725 AI clusters and 80M H100 equivalents globally.
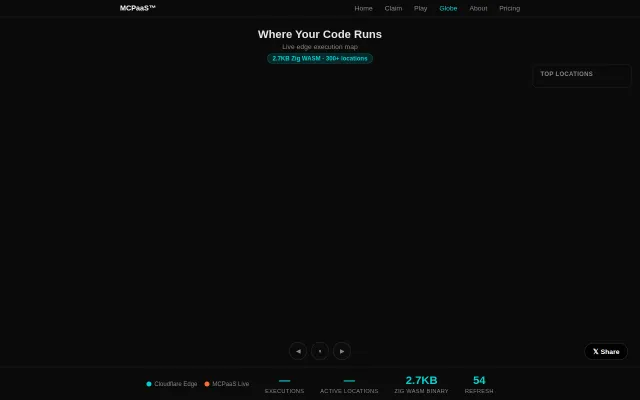
2.7KB WASM rendering live edge executions is technically impressive demoscene craft.