Developer Tools●●Solid
Ktop – a themed terminal monitor for GPU, CPU, RAM, temps and OOM kills
Monitors GPU+CPU+memory in one themed terminal view—leaner than Glances.
Solve My ProblemEye Candy
brontoguana
305mo ago
A native Apple Silicon activity monitor for llama.cpp
Finally answers if llama.cpp is actually working by reading Apple GPU counters directly.
AI developers, local LLM runners on macOS
htop · Activity Monitor · nvtop
Monitors GPU+CPU+memory in one themed terminal view—leaner than Glances.
Per-app wattage attribution using RAPL and GPU counters when other monitors only show component totals.
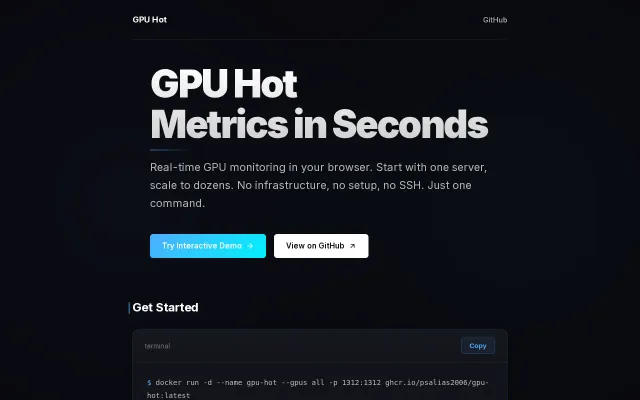
Shoots for zero-setup GPU visibility: one docker run spins up a service you open in the browser to see live NVIDIA metrics without Prometheus, SSH, or dashboards to configure. The UI and interactive demo show attention to UX and make it instantly useful for small clusters or single-node setups. It doesn’t reinvent observability — if you need long-term metrics, alerting, or enterprise integrations you’ll still reach for exporters + Grafana — but for lightweight, immediate GPU troubleshooting this is convenient and focused.
Direct NVML access beats nvidia-smi subprocess calls for speed and reliability.
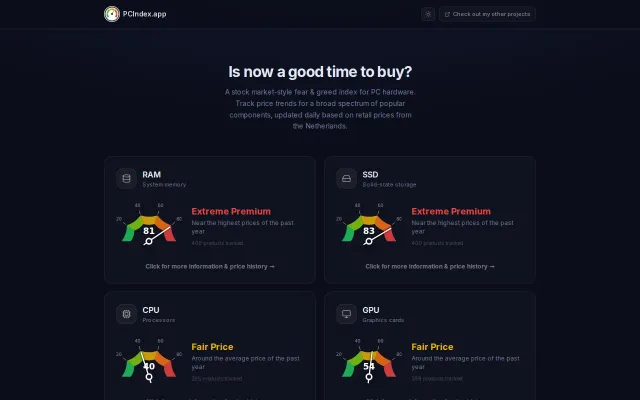
Fear-greed index for PC parts, but limited to Dutch pricing and 12-month history.
MCP wrapper around AppControl — Windows only, requires the desktop app running.