Data●●Solid
60 Years of Metal Music Data, Visualized
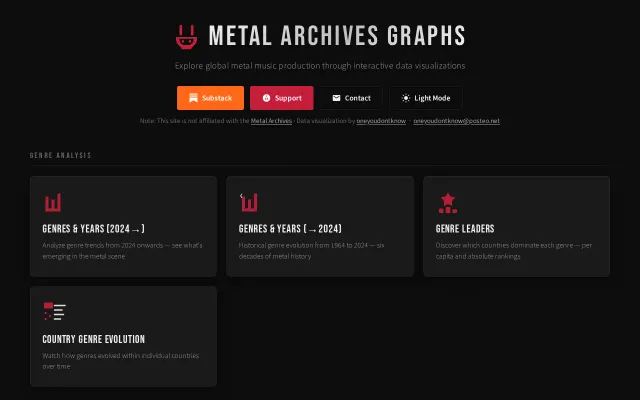
60 years of metal data with regional breakdowns, but it's a visualization site without downloadable datasets or API.
Niche GemRabbit HoleEye Candy
oneyoudontknow
503mo ago
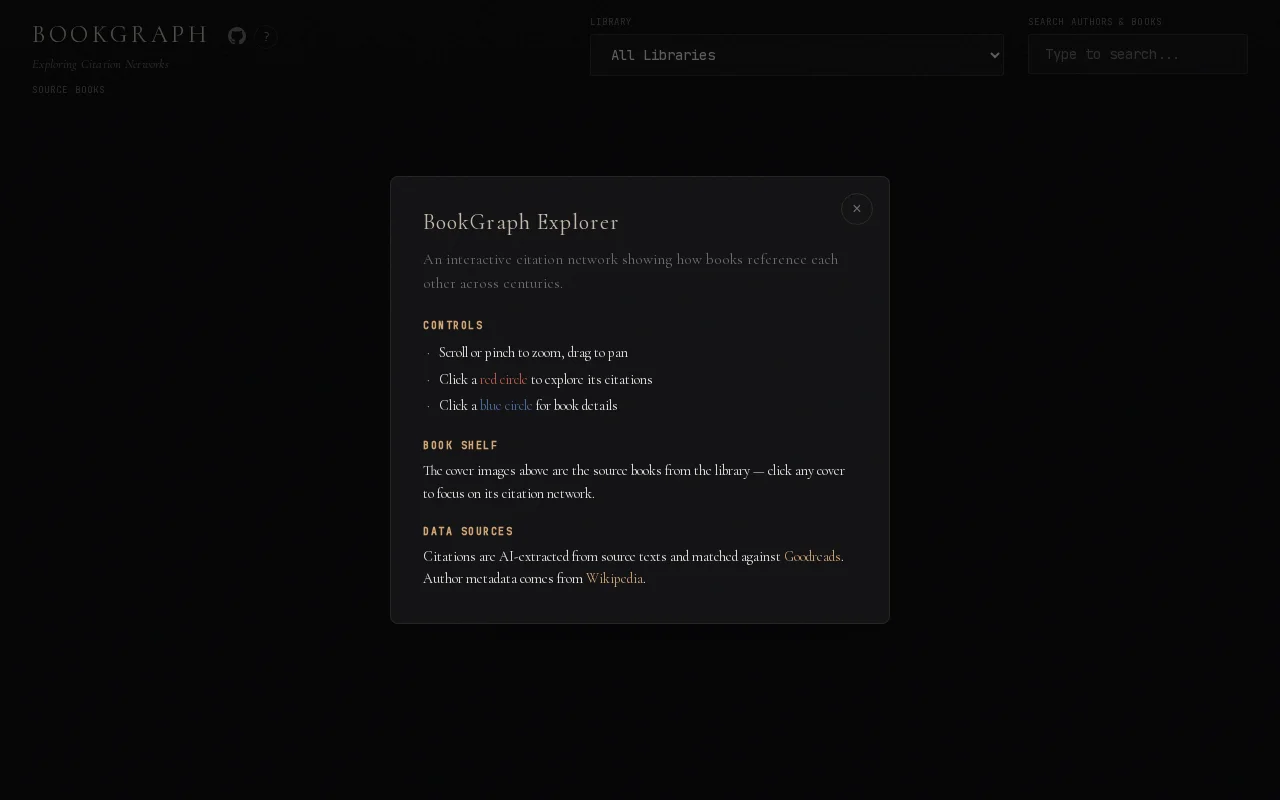
3,000 years of literary citation networks visualized with WebGPU; LLM pipeline resolves messy bibliographic data.
Literary scholars, book enthusiasts, researchers exploring citation patterns and literary history
Google Books Ngram Viewer (temporal text analysis) · Connected Papers (citation mapping) · D3 force-directed graph projects
1) The LLM-powered pipeline to extract citations (books + authors) from books and resolve them using both Wikipedia and Goodreads with offline copies I have. The result is data associating Books/Authors to other Books/Authors with accurate bibliographical information spanning centuries.
2) A WebGPU + D3.js powered visualization tool written by Claude Code so I'm able to deal with all this data on the browser on a more or less comfortable experience for the viewer.
I spent some months on a off with this project, and definitely the most challenging part was dealing with accurate bibliographical information across centuries, with original publication dates and etc. For that I wrote what is now a very complex pipeline with LLMs (I used DeepSeek V3.2) wired on offline Goodreads and Wikipedia databases + a fallback that actually uses the internet.
Hope you enjoy it! Open to suggestions on how to improve the system :)
Code is here: https://github.com/ThiagoLira/bookgraph-revisited
60 years of metal data with regional breakdowns, but it's a visualization site without downloadable datasets or API.
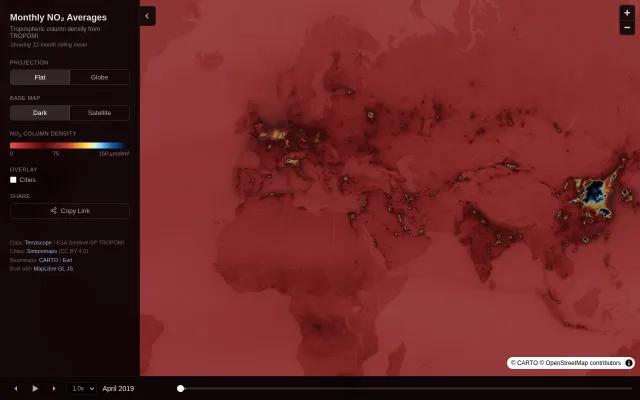
12-month rolling mean with time scrubbing reveals pollution patterns from 2019 to present.
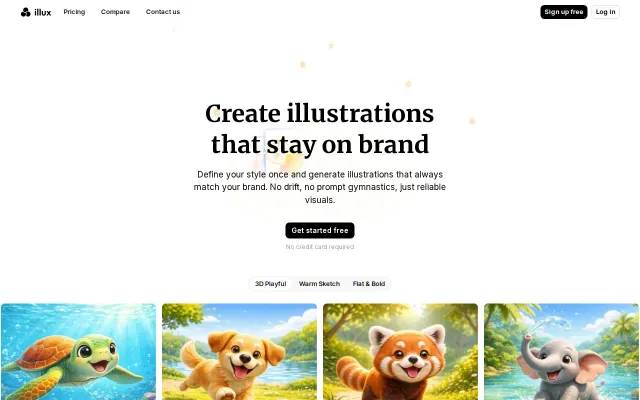
Style fingerprint from references beats Midjourney's --sref for brand consistency.
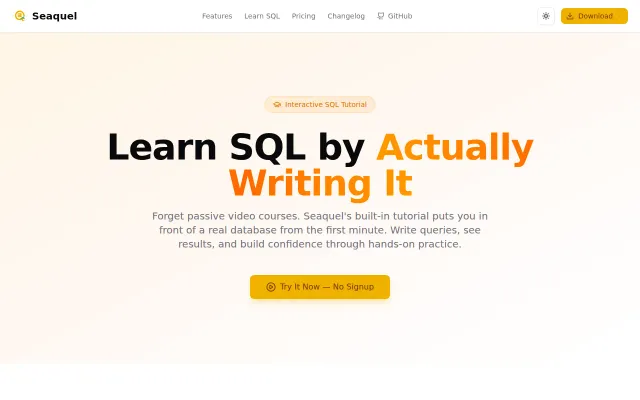
The side-by-side visual builder and live SQL editor is the real payoff — drag tables onto a canvas, draw joins, and watch the SQL and results update so JOINs actually click. It's not a novel database, but shipping an in-browser SQL sandbox with a downloadable client, sample e‑commerce dataset, and no-signup access makes this a very effective, demo-friendly way to learn tricky SQL concepts.
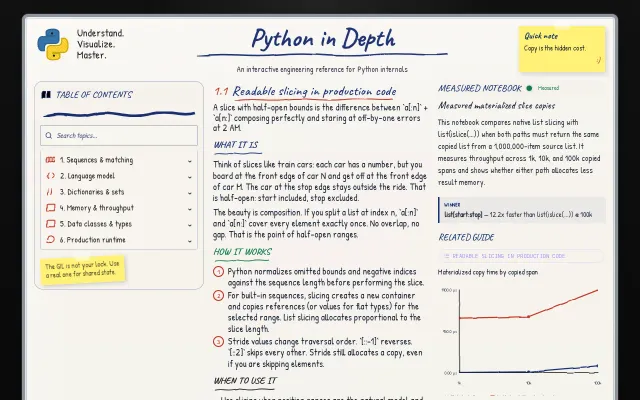
Visualizing Python internals with actual benchmark data beats dry documentation.
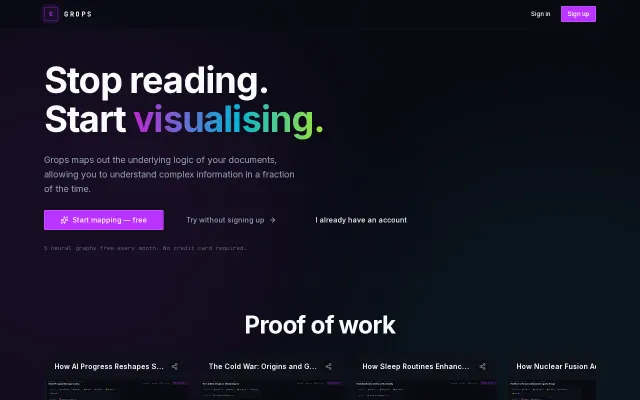
Another AI document summarizer with pretty graphs in a crowded field.